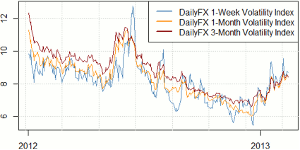
Forex market volatility expectations remain high, and we continue to favor volatility-friendly breakout trading systems, says DailyFX quantitative strategist David Rodriguez.
A continued surge in forex market volatility leads us to believe that volatility-friendly trading strategies may continue to outperform through the coming week of trading. Past performance is not indicative of future results, but it is worth noting that several of our sentiment-based trading strategies have historically done well in times of such strong market moves.
Volatility remains especially elevated in Japanese yen currency pairs as recent controversy over Japanese monetary policy gives reason to believe that the currency will see noteworthy price swings. The US dollar likewise eyes big moves as the Dow Jones FXCM Dollar Index (USDOLLAR) may have hit a short-term reversal point as it hit fresh multi-year highs.
DailyFX Forex Volatility Indices
Our DailyFX volatility indices continue to trade near year-to-date highs and suggest overall markets will remain volatile. Said indices measure volatility expectations seen through FX options prices and serve as traders’ best guess as to how much markets will move within a specific stretch of time.
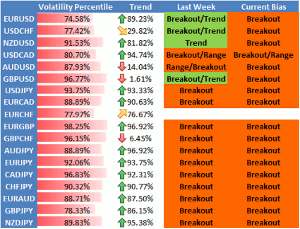
We use those same market prices to derive our “volatility percentile” figures in the table below. These percentiles compare current volatility expectations with the past 90 calendar days, and our statistical studies show that breakout-based trading strategies have historically done well when these figures have been above 75%.
Strong moves similarly warn against employing range trading-based strategies on the risk of significant breakouts in price.
View the table below to see our strategy preferences broken down by currency pair.
DailyFX Individual Currency Pair Conditions and Trading Strategy Bias
Volatility Percentile – The higher the number, the more likely we are to see strong movements in price. This number tells us where current implied volatility levels stand in relation to the past 90 days of trading. We have found that implied volatilities tend to remain very high or very low for extended periods of time. As such, it is helpful to know where the current implied volatility level stands in relation to its medium-term range.
Trend – This indicator measures trend intensity by telling us where price stands in relation to its 90 trading-day range. A very low number tells us that price is currently at or near 90-day lows, while a higher number tells us that we are near the highs. A value at or near 50 percent tells us that we are at the middle of the currency pair’s 90-day range.
Range High – 90-day closing high
Range Low – 90-day closing low
Last – Current market price.
Bias – Based on the above criteria, we assign the more likely profitable strategy for any given currency pair. A highly volatile currency pair (volatility percentile very high) suggests that we should look to use breakout strategies. More moderate volatility levels and strong trend values make momentum trades more attractive, while the lowest vol percentile and trend indicator figures make range Trading the more attractive strategy.
By David Rodriguez, Quantitative Strategist, DailyFX


