
As market trends develop, a simple trend following strategy is trading breakouts in the direction of the trend, says Jeremy Wagner of DailyFX Education, and he shares examples of the strategy using two widely followed currencies.
With market volatility picking up in 2013, we have seen some strong trends break out in forex cross pairs. A breakout strategy using the Donchian channel (or commonly known as price channels) is a simple set of buy and sell rules to follow. However, the most challenging aspect of trading a breakout strategy is to determine which markets to trade the strategy in.
You see, strategies are not designed to do well in all market environments and a breakout strategy is no different. There are market conditions when strategies will do well and other conditions when strategies will experience a drawdown. One way to overcome this obstacle and improve consistency is to know what type of market conditions your strategy is designed to do well in. Once that is determined, seek out currency pairs that are exhibiting those market behaviors right now.
For a breakout strategy to have a better chance of success, find markets that are trending or experiencing volatility. Many traders analyze the market and create a trading bias by determining the direction of the trend. This is a great start. Once the direction of the trend is determined, filter your trades in that direction.
So if the trend is up, look for long breakouts. If the trend is down, look for short breakouts.
I'm going to provide you a bias I'm watching regarding the euro and yen and how to implement a breakout strategy to trade them.
Trading the Euro
For the past six months, the euro has
been one of the strongest currencies and we'll look for that strength to
re-emerge at lower support levels.
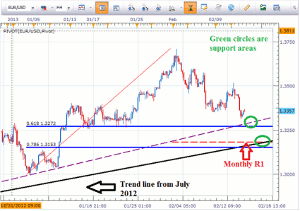
Since the euro has been one of the strongest currencies, it qualifies as a candidate to consider a breakout strategy on. Lately, the euro has been falling from its high at 1.37 and is approaching some strong support levels. These strong support levels are likely to produce some type of bounce. Therefore, the correction has been deep enough to relieve the overbought condition on the euro.
EUR/USD Strong Uptrend
Click
to Enlarge
(Created using FXCM's Marketscope 2.0 charts)
From a technical analysis perspective, prices of the EUR/USD are near 1.3280, which is minor trend line support (see purple dotted line) and the 61.8% Fibonacci retracement level of the previous uptrend (blue line). If this support zone fails, then strong support exists near 1.3200 which is guarded by another trend line, the monthly S1 pivot level, and the 78.6% Fibonacci retracement level.
NEXT PAGE: Breakout Trading in EUR/JPY
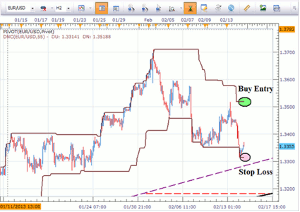
|pagebreak|As a result, the EUR/USD appears to be well supported even if prices dip slightly below current levels. Therefore, we want to consider a bullish bias on the currency pair and implement our Donchian channel strategy to the buy side.
Donchian Channel Strategy on the EUR/USD
Click
to Enlarge
Therefore, if you wish to trade the EUR/USD, you can implement a Donchian channel breakout strategy using a two-hour price chart and the Donchian channels with a 55-period input value. That way, when prices break out to new highs above the upper Donchian channel, that is your indication that prices may be poised to continue higher.
The upper channel currently sits at 1.3521 so we place the entry order to buy at 1.3522, which is 1 pip above the upper channel.
In this case, the lower Donchian channel will act as the stop loss when the trade executes. The lower channel is at 1.3314.
Trading the Yen
The Japanese yen has been one of the
weaker currencies for the past couple of months. A simple analysis of its trend
clearly shows the yen weakening at a blistering pace. If we match up a strong
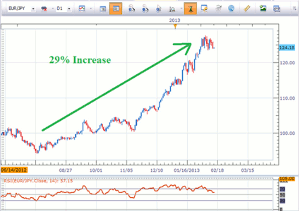
euro against a weak Japanese yen, we get a trend on steroids. The EUR/JPY cross
pair has increased 29% since August 1, 2012, which is a tremendous move.
EUR/JPY 29% Trend
Click
to Enlarge
One concern for many traders is chasing an extended trend. There is a simple method to follow to determine if the yen crosses have corrected deep enough to relieve the overbought readings. As we can see below, the EUR/JPY has tagged the lower Donchian channel, which indicates the correction has met minimum requirements to relieve the overbought condition. However, this doesn't mean the pair must move higher.simply that we can begin looking for opportunities to buy the pair, which is the direction of the overall trend.
EUR/JPY Donchian Channel Strategy
Click
to Enlarge
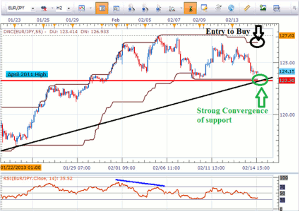
From a charting perspective, the EUR/JPY has trend line support converging near the same price level as the April 2011 high. This line has many similarities to the trend line support of the EUR/USD. This trend line will likely produce some type of reaction to the upside. Therefore, we have a back drop for our trade to set up our orders to buy the pair.
According to the Donchian channel strategy, we would place an entry to buy 1 pip above the upper channel. The upper channel currently rests at 126.96 so the entry order is placed at 126.97.
The stop loss is placed at the lower channel. The lower channel currently sits at 123.41. While waiting for the orders to trigger, you'll need to check in on the positioning of the channels and adjust the orders as needed.
By Jeremy Wagner, Head Trading Instructor, DailyFX Education


