
Mass movements of human psychology, as represented by the financial markets, are subject to the mathematical laws of nature, says Kristian Kerr of DailyFX.com, and various geometric, arithmetic, statistical, and cyclical techniques can help traders gain a better understanding of markets and their corresponding movements.
Foreign Exchange Price & Time at a Glance
Charts Created using Marketscope–Prepared by Kristian Kerr
Click
to Enlarge
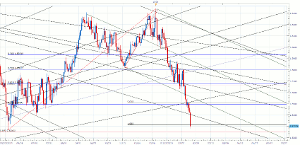
- Cable failed at the 1x8 Gann line from the 2007 high in early January and the decline that has followed remains in full force.
- Aggressive weakness through a key Fibonacci cluster in the 1.5500 area over the past few days keeps focus immediately lower.
- The 50% retracement of the 2009 range at 1.5250 now a key support level and the next key inflection point.
- Cyclical turn window last week failed to elicit any sort of meaningful upside response and this is further evidence that the current downtrend is gaining strength.
- Next minor turn window not seen until early next week.
Strategy: Stay short with stops above 1.5405, but only over 1.5510 warns of a broader reversal.
Charts Created using Marketscope–Prepared by Kristian Kerr
Click
to Enlarge
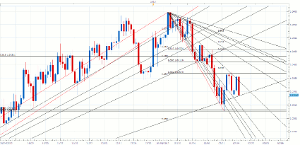
- AUD/USD upside attempts continue to fail at the 38% retracement of the year-to-date range and this keeps our bias lower.
- A 1x1 Gann angle drawn from the low close in 2012 now in the 1.0270-80 area is immediate support.
- However, a close below the 38% Fibonacci retracement of the late 2012 advance near 1.0230 is required to prompt a more meaningful move lower.
- Shorter-term focused cyclical techniques are positive over the next couple of days.
- Only over 1.0370 during this time signals that a broader upmove is developing.
Strategy: We like holding short positions in the Aussie while under 1.0370.
Charts Created using Marketscope–Prepared by Kristian Kerr
Click
to Enlarge
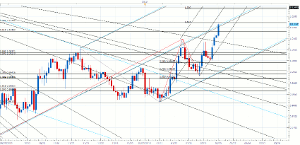
- USD/CAD convincingly broke above the 1x4 Gann line from the 2012 high early this week.
- Subsequent strength has seen the 61.8% retracement of last year’s range easily overcome and focus is now higher.
- Resistance now being found in the 1.0170 area, which is a Fibonacci convergence of the 38% retracement of the 2011 range and the 161.8% extension of the early February move lower.
- This level is likely a key near-term pivot with strength above required to trigger a move towards the next Fib zone near 1.0240.
- Minor cyclical turn window seen around the end of the week.
- Convergence of the aforementioned Gann line and a pitchfork line connecting January and February lows near 1.0085 now critical support.
Strategy: Maintain long positions in funds while the exchange rate is over 1.0085.
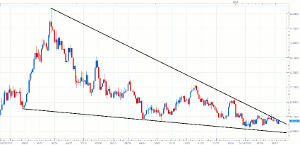
Focus Chart of the Day: USD/MXN
Click
to Enlarge
The pi cycle related reversal we have been writing about looks to be playing out in the Kiwi. Further weakness below the .8345 second square root progression from last week’s high in the next few days will be more evidence that a move lower of greater magnitude is materializing.
USD/MXN, on the other hand, has been less cooperative as the pair continues to meander in a pretty tight range. This is somewhat surprising given the extreme positioning in the peso, though the lack of any real direction heading into the turn window does not help matters. We will give it a few more days before throwing in the towel on the notion of a dollar move higher, but strength over 12.8100, and probably 12.9000, is really needed. Should new lows be seen after the conclusion of this cyclical turn window, then it will be a strong signal that the downtrend in USD/MXN still has more to go.
By Kristian Kerr, Senior Currency Strategist, DailyFX.com


