How traders use the RSI indicator depends specifically on market conditions, and here, Walker England of DailyFX.com reviews trading gold with RSI in extended market trends.
The relative strength index (RSI) is a technical indicator designed to help us define market entries for a variety of trading conditions. However, depending on if the market is ranging or trending, traders should approach the overbought and oversold levels pictured below very differently. Today we are going to review the strong trend in gold, and exactly how RSI can be used to pinpoint market entries.
RSI Indicator Levels
RSI Crossovers
Normally traders look to initiate new
market orders when RSI swings back above an overbought or oversold value. This
method is referred to as trading RSI crossovers. The rationale behind this is
that traders are looking to buy when prices are low or sell when prices are
relatively high. This can be a great strategy and normally will work when the
market is in a range bound environment used in conjuncture with support and
resistance levels.
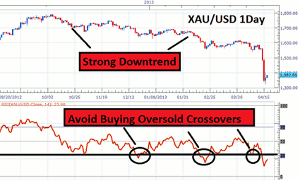
However, at the moment, this strategy is not conducive for trading gold. Due to the market being in a strong downtrend, traders should absolutely avoid entering trades when RSI crosses back above oversold values. The chart below tells the full story of the perils of buying RSI signals in a downtrend. In each of the last three examples, as RSI crossed back above 30, gold proceeded to move towards lower lows. This is absolutely a scenario all traders should look to avoid! So how can we use RSI in a trending market?
XAU/USD with RSI Crossovers
Using RSI Momentum
Looking at the chart below, we can
see that RSI may remain oversold in a downtrend for an extended period of time.
This can often be disheartening for swing traders as they wait for RSI to move
back above oversold values for a chance to sell a RSI crossover in a downtrend.
The good news is, this is not the only way to trade using RSI! Let's look at
another way of trading the indicator.
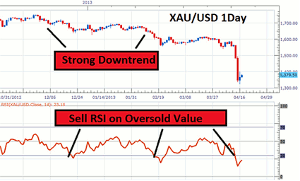
One of the most overlooked ways we can use RSI in this environment is to sell into oversold values. This style of trading may seem counter intuitive at first, but it is very similar to trading a breakout. As price continues to decline and create new lows, the RSI indicator will become oversold. Traders watching this momentum can actually institute new trades when RSI moves below 30. The gold chart below is an excellent example of this technique at work. Instead of waiting for an upswing in momentum to buy, we will use a swing in momentum to sell.
XAU/USD with RSI Crossovers
Using this technique each new low on RSI will provide a new signal for traders as long as the downtrend in gold continues. It is important to remember that market conditions are always subject to change. When the market trend ends, RSI traders can then shift gears and use a RSI range trading strategy.
By Walker England, Trading Instructor, DailyFX.com


