Pivot points are a price-based indicator that helps a trader find “tipping points” in the market, which can then provide you with a higher probability entry, writes Tyler Yell of DailyFX.com.
Leading vs. lagging indicators is a usually a heated debate. Lagging indicators like moving averages or oscillators help you confirm the trend and enter after it’s begun whereas leading indicators can help you see where price action could travel should the move continue or the range hold. Today, we’ll show you how to use pivots to not only identify the trend but also to use pivots to spot entries and targets.
What Is A Pivot Point?
Pivots points are a calculated “tipping point” coupled with likely levels of support or resistance based on the prior high, low, and close of a chosen period. This extremely powerful price-based level generator can help you see whether a move could peak or turn. They are sometimes referred to as floor pivots because historically many traders on the floor of an exchange would keep these numbers in front of them at all times to forecast significant price points on the day’s action.
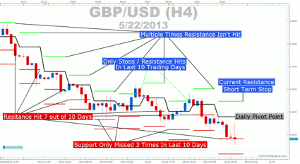
Pivots in Action on GBP/USD Downtrend Targeting Daily Support

Presented by FXCM’s Marketscope Charts
Click
to Enlarge
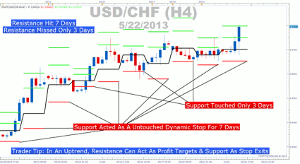
Pivots in Action on USD/CHF Uptrend Targeting Daily Resistance

Presented by FXCM’s Marketscope Charts
Click
to Enlarge
Pivot points are drawn as the black line that a majority of the time shows you the bias for the day’s action. Support and resistance are displayed as red and green lines respectively. These are the levels you can focus on when using this tool.
Pivot Trading Strategy
When a trend has been identified, you can target the complementary levels for profit targets and the opposing levels as a stop. There are multiple methods for identifying the trend. If you want to stick with pivots as the sole indicator on your chart, then rising pivot lines can show you an uptrend and the opposite for a downtrend.
In a downtrend, price can come up to or near the pivot and then bounce off and head towards the support levels as a daily profit target. In the downtrend example above with 10 trading days of GBP/USD, price hit the support levels (targets in a downtrend) seven days while only hitting resistance (stops in a downtrend) two days. This helps you see that price action near the pivot that begins to move back in the direction of the trend has a high propensity of hitting the target.
In an uptrend, price action favors the resistance levels almost in a magnetic fashion as price pushes higher. Support can be used as your stop for the day and if you decide to ride the trend out, you can move or trail your stop to the next day’s support level. USD/CHF also shows a scenario where the stop was only hit three times out of a 10-day sample.
How to Add Pivots to Your Charts
The pivot point formula is simple. Pivot points take the high, low, and close, which are seen as the most important prices to build the pivotal levels that we can trade from. Here is the formula for you:
P= (H+L+C)/3= pivot point
Once the pivot levels are added you can look for price action to move to one of these levels respective of the trend. True to form, limits and stops on your trade are based on support and resistance levels.
By Tyler Yell, Trading Instructor, DailyFX.com


