Everyone from leading economists to fund managers who don't normally dabble in FX publicly talked about their plans to load up on short yen positions and they have done well since the beginning of the year, says Kathy Lien of BKForex.com.
Selling the Japanese yen was one of the most popular trades of 2013. Between January and mid May, the yen dropped more than 16% against the US dollar, 13% against the euro, and 9% against the British pound. Five months is a relatively short period of time for a move of this magnitude but it was supported by monetary policy and economic fundamentals including the performance of bonds and equities. However, the short yen trade started to look very slippery in late May into early June when the yen started to rise rapidly. The closely watched USD/JPY pair peaked at 103.74, dropped below 100, and hit a low of 95 last week. This aggressive reversal, which happened within 2.5 weeks led many traders to wonder if the best trade of 2013 is now over.
To answer this question, we need to first recognize that investors who sold yen at the beginning of the year are still deep in profit. Between January and May, USD/JPY rose as much as 21.7% and is currently only 4.2% off its high, which means that it is still up more than 17%. From the perspective of trade management, while many of these investors are not happy to see the recent rise in the yen, and some could have even been shaken out on the move below 100, a 4% drawdown won't be enough for most of these investors to hit the panic button. In fact, the nearly 350-pip rally from 95 to 98.50 that we've seen in USD/JPY on Friday and Monday reflects bargain hunting and the reload of short yen positions by some investors.
Rethinking the Impact of Abenomics?
However the real question should be whether the fundamentals driving the USD/JPY rally or the yen sell-off that began in November have changed, making this a real top in USD/JPY. There is no question that we have seen a significant amount of deleveraging in the equity and bond markets. Some of the assumptions about the implications of Abenomics have not transpired, the most important of which is un-hedged Japanese foreign investment. The rise in the Nikkei in the beginning of the year made Japanese investors net sellers of foreign bonds. The message from the Japanese has also been mixed with the Bank of Japan setting up the market for a long period of aggressive bond purchases (hence long USD/JPY trades) but then warning about the risks of inflation. Prime Minister Abe also failed to introduce new prescriptions to fix the economy when he unveiled his latest policy agenda to everyone's disappointment. At the same time, the slide in US stocks and uncertainty about Fed tapering caused widespread deleveraging that led investors to cut their long dollar positions. In turn, investors have been rethinking the impact of Abenomics.
NEXT PAGE: Has the USD/JPY Topped?
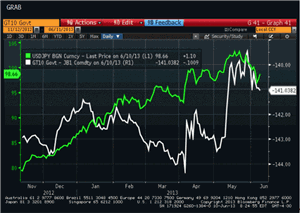
|pagebreak|The following chart of USD/JPY (green line) and the spread between US and Japanese 10-year bond yields (white line) actually says it all. USD/JPY has been falling because the spread between US and Japanese yields have dropped sharply. 10-year JGB yields have been unusually volatile, discouraging Japanese investors from buying foreign bonds and leading to a sharp sell-off in USD/JPY. Japanese economic data continues to improve while we have begun to see some unevenness in US data.
Is 103.74 “the Top” in USD/JPY?
The next few percentage point moves in USD/JPY will be determined by the direction of US and Japanese monetary policy, both of which have caused uncertainty in recent weeks. Investors are still trying to figure out how serious the Federal Reserve is about tapering asset purchases this year and this week's retail sales report will help shape expectations. However unless there is a big surprise in retail sales, the outcome of today's Bank of Japan decision should have the larger impact on USD/JPY. The best case scenario for USD/JPY is if the BoJ extends the maximum duration of its funds supply operation from one to two years and increases the frequency of bonds purchased. Given the sharp decline in the Nikkei and the volatility in the yen, we suspect that the central bank will be eager to stabilize the markets. However, there have also been improvements in economic data and the BoJ Governor previously criticized successive policy actions, which means he could do nothing more than an operational tweak of the maximum duration of their funds supply operation, which would be a disappointment for USD/JPY. The worst case scenario for USD/JPY would be if US retail sales missed expectations and the Bank of Japan failed to deliver.
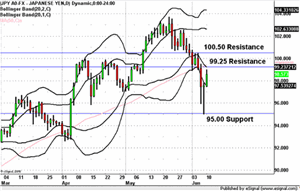
As shown in the daily chart above, USD/JPY is in the sell zone according to our double Bollinger bands. There is near-term resistance at the 50-day SMA and first standard deviation Bollinger band at 99.25 but obviously the key resistance level is 100. However, if USD/JPY breaks above 99.25, it should make a run for 100. If it manages to clear 100.50, then we could see a stronger recovery to 102. However right now, the momentum is still skewed to the downside until 99.25 is broken, which means trades should be mindful of support at last week's low of 95, which is also a psychologically significant technical level.
By Kathy Lien, Co-Founder, BKForex.com


