Rick Wright of Online Trading Academy details a simple way for traders to identify and trade high-probability set-ups.
This week I'd like to go all the way back to the very basics of what to look for when you are looking to place a trade. In previous newsletters, you have probably heard writers mention your trading plan. Included in the trading plan should be the setups or combination of things on the chart that you will look for to make a trade. Here is an easy setup/suggestion for your plan.
In Online Trading Academy's core strategy, we suggest that traders buy in demand zones and sell in supply zones. Easy enough. However, a key component to our strategy is to trade in the direction of the larger trend. A relatively easy way to determine or define the trend is to use the trendline tool that I'm sure your broker offers. The basic rule of thumb with trendlines is that it takes two points to draw the line, and the third touch of the trendline confirms it as a tradable or valid line. So what do we do with it then?
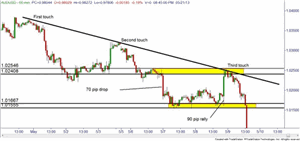
A simple technique that I use is to wait for the price action to hit a trend line that I have drawn in, and then to immediately look straight to the left on the chart. Is the intersection of price and the trendline lining up with a supply or demand zone? In this case it nicely lined up with a very obvious supply level. When that happens, the appropriate trade should be obvious! Provided there is at LEAST a 3:1 reward to risk ratio to your next demand zone (for shorts, supply zones for longs) you take the short trade. The stop would go above the supply zone and profit target slightly above the demand zone.
So what made the supply zone so obvious? Well, it does fit into several of our Online Trading Academy odds enhancers list. While I can't give out the entire list in this venue as it wouldn't be fair to our students, I will list a couple odds enhancers that have been mentioned before. The first is the speed that price left the supply zone the last time price was there. From about 1.0250 to 1.0180 in one candle? Seventy pips in sixty minutes? That is pretty fast. Not the fastest I've ever seen, but fast enough for me!
NEXT PAGE: Key Things to Watch
|pagebreak|The next odds enhancer I'll mention is the arrival speed—how fast did price action get back to the supply zone. What is amusing about this chart is that the arrival was just as fast, but came from even farther out than 1.0180! Nearly a 90-pip move in one candle! The arrival speed odds enhancer is one of my personal favorites—mainly because of the psychology involved in the move. Imagine all of the new/inexperienced traders watching this candle rocket straight up. What are they thinking? Certainly not looking to go short! Most new traders see this move happening, and think that a fast move up will continue up to infinity and beyond! Without a care, they chase this trade up, paying higher and higher prices and finally the bigger trend and the previous supply zone overwhelm this short-term move up. Please don't get me wrong—I'm not taking joy in the fact that many new traders are falling into a trap by buying after a quick move up, into supply, into a downtrend—I am enjoying the fact that I am not part of that crowd! Back in 1997 when I first started trading, taking trades like this, it was an expensive lesson that I paid for several times. But I certainly don't pay this tuition/make this mistake anymore!
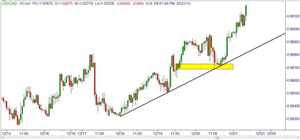
Now, let's go through the steps in an uptrend. First, I draw in a trendline, needing at least two points to draw the line, and any future touches of the line are confirmations that the line is valid. When price action meets the line, immediately look straight to the left and see if there is an intersection with a demand zone. If there is no demand zone, there is no trade! If there is a quality demand zone, time to buy provided there is at least a 3:1 reward to risk ratio from this zone up to the next supply zone.
I intentionally left this chart nearly blank, hoping that you would look at it and try to deduce where the touches are, and why this zone was a good zone. How many odds enhancers did you spot on this chart for that level?
So there you have it—a simple trend strategy, useful for both long and short trades. One of the great things about this technique is that you can apply it to any time-frame chart, and with proper risk management, should help you make quite a few more pips in your trading career!
By Rick Wright, Instructor, Online Trading Academy


