Markets rarely if ever move in a straight line as a trend unfolds. However, when they are trending you’ll often find a reprieve of price as profits are taken or as opposing forces try and take on the current trend, writes Tyler Yell of DailyFX.com.
“Trend following is an exercise in observing and responding to the ever-present moment of now.”
–Ed Seykota
The last two weeks have been seen some major moves in the major currencies. The reasons for these big moves have been due to the news coming across the wires from Central Banks. When moves like these take place, it’s often a great time to consider a trend entry. Before we dig into some real examples, it may be helpful to understand how to trade a trend correction.
Understanding Trend Corrections
When looking at a chart that is trending, you’ll often notice that a currency or other financial instrument moves in a stair step or jig saw manner. This non-linear nature of the markets should be seen from angle of how you can take advantage and trade.
The Non-Linear Nature of Trends with Corrections
When you notice markets moving against the greater trend, you have one main task as a trader. You need to work on identifying the finishing point and where the trend may likely resume so you can enter back in the direction of the overall trend. While this is no easy task, the payoff is often worth the effort.
Identifying a Trend Correction’s End
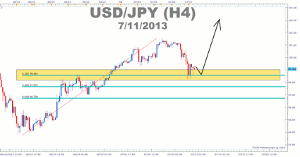
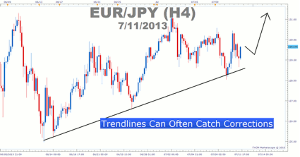
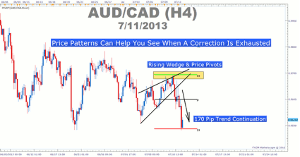
There are many tools you can use to identify the ending point of a trend correction, however none of them are right 100% of the time. A favorite of many traders would likely be a Fibonacci retracement number, trendline bounce, or price pattern playing out. As you can imagine, it’s great when these combine together and the trend resumes.
Strong Trends Often Stop Correcting at the Fibonacci 38.2% Level

Presented by FXCM’S Marketscope Charts
Click
to Enlarge
Strong Trends Can Also Stop Its Correction on a Trendline Bounce

Presented by FXCM’S Marketscope Charts
Click
to Enlarge
Price Patterns Can Help You Gauge When a Correction Has Played Its Course

Presented by FXCM’S Marketscope Charts
Click
to Enlarge
After the Correction Has Been Identified
Once you have found a strong trend correcting and that correction is potentially ending, you have two more steps. The first step is to determine where you would like to enter into the trade. After you’ve decided where to enter a trade, you need to make sure you have a favorable risk to reward ratio.
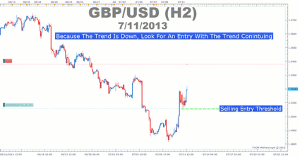
Find an Entry Back into the Direction of the Original Trend

Presented by FXCM’S Marketscope Charts
Click
to Enlarge
As you can see above, the entry has two key elements. The first element is that you’re looking to enter when the correction with an entry order. This is because an entry order waits for you to enter until the trend has likely played out and price is appearing to continue with the trend. The entry also allows you to stay away from the trade if the trend has broken and moves the other way.
Closing Thoughts
Traders often decide to pull the trigger and enter back into the direction of the original trend when a breakout occurs with the new trend. Once in the trade, in the direction of the trend, you’re only edge is risk management through risk to reward ratios. We recommend that at the very least, you not risk more than you’re looking to make on your trade.
By Tyler Yell, Trading Instructor, DailyFX.com


