
In late April, the Aussie dollar started its decent from 1.0580 down to 0.8850 in early August. While we never look to stand in front of a trend, the tide looks to be turning as we see multiple reasons to keep our risk tight and look for the pair to move higher as we cover specific risk points to focus on, writes Tyler Yell of DailyFX.com.
"Bull markets are born in pessimism, grow on skepticism, mature on optimism, and die of euphoria."
-Sir John Templeton
Few currencies have confused as many traders as the Australian dollar. Looking into our internal research, we can see that retail traders have been bullish the Australian dollar since May when it fell from 1.0580 down to a low of 0.8850. However, for the first time since May, many technical or chart indicators are starting to align and showing that a move higher could have some merit.
Combining Fundamental with the Charts
Over the last few
days, you have likely seen a lot of strength in the Australian dollar. If you
look at the fundamental drivers of the currency via the economic calendar,
you'll notice a lot of favorable data is coming to light showing that the
Australian dollar could continue higher. Over the weekend an election took place
that has aligned their agenda to economic development that is favorable the
Australian dollar. Also, Chinese data, which affects the Australian dollar due
to their trade relationship came in upbeat which helped the Australian dollar
find a good amount of buyers as sellers were sparse.
Ichimoku & Other Technical Patterns Showing
AUD Upside
At its heart, Ichimoku
is a trend following indicator that can't predict the future but can help you
clearly see the trend. As traders ourselves, we like to trade trends of all
degrees and encourage you to do the same and that is why we like Ichimoku. In
addition to identifying the trend, Ichimoku can help you interpret price action
so you can find a good entry in the direction of the trend.
When Ichimoku is applied to your chart, there are a few things you should be looking for to see if a trade opportunity is present. On the time frame of your choosing, check to see where price is trading in relation to the cloud. If price is above the cloud, then you can see that a bullish set up is in the works. Next, look to see if the moving averages of the indicator are complementing the trend. In other words, is the shorter moving average favoring the slower moving average? This shows you if the momentum is moving appropriately.
Lastly, you want to see if the momentum aspect is in line with the trend. Ichimoku utilizes a unique method to measure momentum by looking at how current price compares to price 26 periods ago. Simply put, if price now is higher than price from 26 periods ago, then you should be looking for higher prices. On my charts below, you can see a bright green line that I have augmented so you can clearly see when momentum is favoring the trend by being displayed on the same side as the cloud.
Trades of the Week: Ichimoku Presents AUD Bulls with Multiple
Options
Most Ichimoku reports present you with one trade that you
can use as a guiding light for trading with Ichimoku according to the rules
below. This report, presents you with two trades off the back of the impressive
AUD strength. The first that we'll look at is the AUD/USD
potential trend reversal.
Trendline Breaks & Ichimoku Buy Signals Align on AUD/USD
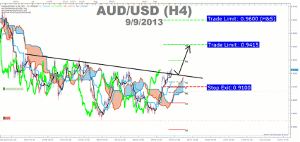
Presented by FXCM's Marketscope Charts
Click to Enlarge
Entry to Buy: Strong Price Action
Signal Above 0.9200
Stop:
0.9100 (recent price support on prior correction)
Limit: 0.9415 (conservative with
trend target near June high)
-Full candle bodies above the Kumo cloud
-The
trigger line (black) is above the base line (light blue) or is crossing
below
-Lagging line is above price action from 26 periods
ago (bright green line)
-Kumo ahead of price is bullish and
rising (blue cloud = bullish Kumo)
Ichimoku is a great tool to help you see when a trend is reversing based on when price and the lagging line break through the clod. On the chart below, the AUD/USD trend has shifted from a great bear trend to a potential reversal that we hope to catch with this trade. Outside of Ichimoku, there is a price pattern called an inverted head & shoulders that is developing on this pair. Trend reversals as displayed with Ichimoku are a riskier trade so it's best to keep your stops rather tight in case the analysis is wrong.
Neckline Break on AUD/USD Inverted Head & Shoulders
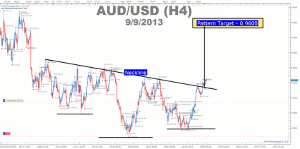
Presented by FXCM's Marketscope Charts
Click to Enlarge
AUD/JPY also presents a lot of potential upside as price action has displayed a potential double bottom off the 61.8% retracement point and Ichimoku has presented a bullish signal.
AUD/JPY Buy Signal on Ichimoku with Potential Double Bottom in the Books
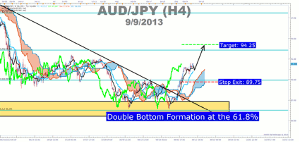
Presented by FXCM's Marketscope Charts
Click to Enlarge
Entry to Buy: Strong Price Action
Signal Above 91.50
Stop: 89.75 (bottom of H4
cloud)
Limit: 94.25 (Weekly R2 Level)
By Tyler Yell, Trading Instructor, DailyFX.com


