Geometrical shapes are not just for geometry class anymore, says Gregory McLeod of DailyFX.com, as he explains their use in forex trading.
Do you remember asking your teacher in school, “How am I going to use this geometry stuff in the real world?” Well, you will get the answer as we take look at another popular forex price pattern, the pennant. You will learn how to correctly identify the pattern and how to set stops and limits in both bullish and bearish scenarios.
Pennants are continuation patterns that resemble its “cousin” the forex triangle pattern. They are both constructed of lower highs bound by a downward sloping resistance trend line and higher lows bound by a rising uptrend line.
The two trend lines converge at a point called the apex. At first glance, that sounds like the exact description of a triangle. However, here are some additional features that differentiate the forex pennant from the forex triangle.
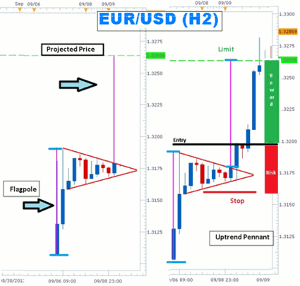
Euro Pennant Breakout with Money Management

(Created using FXCM’s Marketscope 2.0 charts)
Click
to Enlarge
The first is that the pennant is formed by a nearly vertical flagpole of wide ranging bars similar to the flagpoles found in forex bull flags and forex bear flags.
The second difference between a forex pennant and a forex triangle pattern is that the pennant has to be formed of fewer that 30 Japanese candlesticks.
Then pennant represents a momentary pause in aggressive price action. This “timeout” and rest for price is short and the trend usually resumes within a few bars. It is an ideal pattern for traders who have missed the initial move and who have resisted the temptation of chasing price.
How to Trade the Forex Patterns
In an uptrend, traders can place a stop below the pennant consolidation and place an entry order four pips above the highest swing high within the pattern. A protective stop can be placed four pips below the lowest swing low within the pattern. Traders can determine price targets by measuring the height of the flagpole and projecting this measurement from the apex of pennant
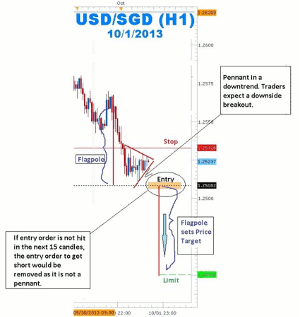
USD/SGD Forex Pennant in a Downtrend
In a downtrend, traders can place a stop four pips above the highest swing high within the pattern. An entry order can be placed four pips below the lowest swing low within the pattern.
Unlike triangles, which could break out up or down to either continue the trend or reverse the trend, pennants are continuation price patterns. This characteristic can provide traders a greater degree of confidence in knowing the direction to trade. Knowing the direction to trade is half the battle and when a pennant is raised on the chart, traders can act decisively!
By Gregory McLeod, Trading Instructor, DailyFX.com


