Forex symmetrical triangles are important price patterns relied on by traders to identify periods of consolidation ahead of an anticipated large breakout, says Gregory McLeod of DailyFX.com.
Traders like using triangle price patterns because they have risk to reward parameters which are easy to determine from the pattern itself. Not only can the stop be placed just outside the pattern, but a limit can be determined by measuring the height of the pattern and projecting this distance in pips from the breakout point. This is called a measurement objective.
Thomas Bulkowski in his book, Encyclopedia of Chart Patterns, stated that symmetrical triangles meet their upside targets 66% of the time. However, the recent GBP/JPY triangle was part of the 33% of triangle breakout failures.
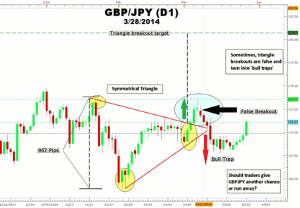
GBP/JPY Symmetrical Triangle False Breakout

(Created using FXCM’s Marketscope 2.0 charts)
Click to Enlarge
As you can see in the chart above of the GBP/JPY symmetrical triangle, a breakout happened at 171.13. Initially, wide-ranging candlesticks breaking above the top of the symmetrical triangle may have led traders to believe the up move had more to go. However, the doji candlestick pattern was joined by a bearish candlestick forming a Japanese candlestick evening star pattern at 173.56 capped this rally.
From this point, we can see an acceleration in bearish price action as a series or red candlesticks form bullish breakout traders are now caught in what is called a “bull trap” in the 167.60 area. Stops are triggered and longs are shaken out. Today, we see a strong surge in yen weakness and GBP/JPY rebounds. The question now is, “should traders give GBP/JPY another chance?”
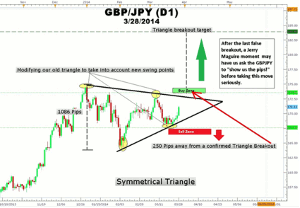
GBP/JPY Daily Chart Revised Symmetrical Triangle

(Created using FXCM’s Marketscope 2.0 charts)
Click to Enlarge
A New Triangle Emerges
If the fundamental and technical reasons that existed when the trade was made still exist after a stop out, then we would consider re-entering the trade. However, forex triangle traders may make modifications to the initial triangle in order to take into account the new swing highs and swing lows.
First of all, the new swing high, which was created by the false breakout is connected to a higher previous high. Next, the new swing low, which was created by breakout below support is connected by an upward sloping trend line from the previous swing low. The result is a new symmetrical triangle with new buy and sell parameters. New limits are set as well.
How to Trade This New Triangle
The breakout method for trading a symmetrical triangle has not changed. However, the triangle has become bigger. Despite the big GBP/JPY big 350-pip run-up last Friday to 171.05, GBP/JPY is another 250 pips from making a confirmed triangle breakout. Triangle resistance is at 172.70 area making a long GBP/JPY trade too early of a proposition immediately afterwards.
If and when GBP/JPY trades above 173.56, a stop can be placed beneath the last swing low of the triangle at around 167.40 with an upside target of 183.91. On the other hand, a close below 167.40 would trigger a sell signal for a bears to trade the triangle south with a target of 156.75.
After the last false breakout, traders may ask GBP/JPY to “show them the pips” with a confirmed triangle breakout before going long GBP/JPY a second time
By Gregory McLeod, Trading Instructor, DailyFX.com


