Tyler Yell, of DailyFX.com, discusses triangle corrective patterns and highlights how to spot and label them, how to identify key points, and why it’s so important for forex traders to learn how and when to trade them.
Have you ever felt like the market has no idea what it wants or where it wants to go? This is often seen on the chart as a trendless sideways move with a lot of overlap and no clear direction. However, if you step back, you begin to recognize a pattern that can provide clues as to the next possible move with a favorable risk reward ratio.
What Do Triangles Mean?
Triangles are a trendless or corrective pattern that allows bulls and bears to find equilibrium after a strong trend. Triangles can happen after uptrend or downtrend and they often mean there is one more punch in the direction of the trend. Another benefit to recognizing and trading the breakout after the triangle is that triangles provide very clear profit targets.
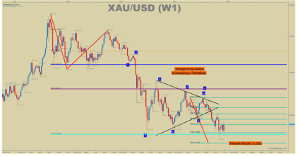
Triangles can be easily identified by drawing trend lines off of converging highs and lows until a breakout occurs. If the trend lines are not converging, then it’s best not to trade it as a triangle. If you have trouble identifying the important highs, you can use a tool like fractals. Fractals will identify the highest high or lowest low over a 5-bar period as seen on the XAU/USD chart below. One thing to ensure is that what you label as the end of the triangle or ‘e’ wave cannot surpass beyond the ‘c’ wave extreme or something else is at play.
Triangles Are Easy to Spot, Knowing How to Trade Them Is What’s Important

Presented by FXCM’s Marketscope Charts
Click to
Enlarge
You’ll likely notice we’ll specifically discuss trading the breakout from the triangle as opposed to entering during the triangle hoping to catch the breakout because a lot of margin can be used up while waiting for a triangle to break and some triangles can take weeks, or months, or years to breakout.
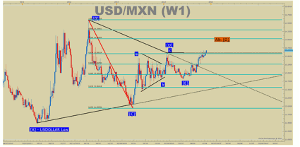
Because of the drawn-out sideways price action, it’s best to label and identify key points of the triangle. For simplicity sake, let’s use Elliott Wave labeling which labels corrections with letters and triangles specifically with a-b-c-d-e for the key points.
USD/MXN Was a 5-Year Triangle

Presented by FXCM’s Marketscope Charts
Click to
Enlarge
When Do Triangle Corrections Occur?
Triangles often occur before the last move of a current trend and rarely in the early part of the trend. However, that doesn’t mean you should start selling into a triangle breakout thinking it will trade lower. It likely will for a short period of time but triangle could have been a fractal part of the overall trend meaning the overall trend will resume much higher. When a triangle breaks as identified by the points below, it’s best to follow and or trade with the overall trend.
How to Trade the Following Breakout
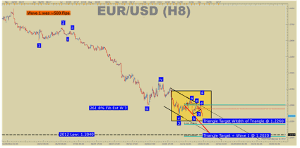
Once the overall trend has been identified as higher or lower and the trend lines have been drawn, we can look to where we can place protective stops and respective profit target ranges. Once a breakout has been identified, an entry in the direction of the overall trend can be entered with a stop set to be trailed below the final higher low of a triangle or lower high in a bearish environment, with a profit target determined by the width of the triangle or a prior trend measurement.
Big Picture EUR/USD—Downtrend Since May

Presented by FXCM’s Marketscope Charts
Click to
Enlarge
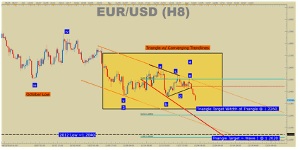
EUR/USD Recently Broke Lower After the Triangle Completed

Presented by FXCM’s Marketscope Charts
Click to
Enlarge
The profit target range for the EUR/USD breakdown from the triangle is from 1.2260-1.2020, but that’s not a point to start buying because an extension could be underway. Either way, the triangle helps us see that the trend is reaffirmed and we should wait for key price action pivots to break against the overall trend before adjusting our biases.
By Tyler Yell, Trading Instructor, DailyFX.com


