
Greg Michalowski, of ForexLive.com, charts the fits and starts of this currency pair and outlines a strategy to better time exits in a forex trade by adhering to his “If…Should Rule” on key price breaks, possibly saving you from losses and even turning losers into winners.
Applying the “If…Should Rule” on key breaks can save you from losses and perhaps change a loser into a winner.
The USD/JPY continues to be the non-trending pair it is, as it continues its fits and starts. In the process, there has been a number of failures, failures that should have led to momentum moves.
For example, on Monday, the price extended below the recent collection of lows (see blue circled numbers in Figure 1 below). The break should have sent the price lower, but the momentum could not extend below the next target at the 116.92 level (low from Jan 19).
Fail.
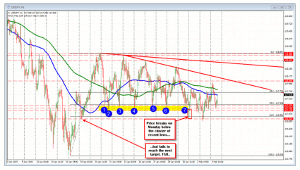
Figure 1: Monday’s Move Failed
Click to Enlarge
Then Tuesday, once again, a move through the cluster of lows. After that, there is a move below the low from Monday and the low from Jan 19. Surely it is going lower now? Wrong (see Figure 2).
Fail.
Figure 2: Break and Fail again.
Click to Enlarge
Wednesday, we saw the price try the other way. The price broke above the 200-hour MA (green line in the chart above). The pair spent Monday and Tuesday finding sellers near the 100-hour MA (blue line). A break above both the 100- and 200-hour MA surely would solicit buying momentum (see Figure 3 below).
Fail.
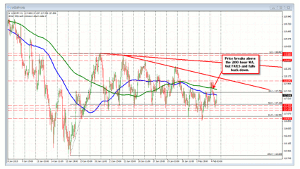
Figure 3: USD/JPY failed above the 200-hour MA Wednesday and falls back down.
Click to Enlarge
That’s three failed grades on the report card in three days. How can traders change the F’s to something better?
Part of being a trader is to recognize failures and benefiting from it. That benefit can come in the form of not keeping on a losing trade or reversing/going the other way.
For example, if you were a seller on Monday when the market opened and fell below the 117.17 low (see Figure 1 above), you are not wrong in selling that break from a technical perspective. The recent price lows came between 117.17 and 117.32. There were seven separate lows in that area over the last eight trading days. That is plenty of reasons to think this is a break that should be traded.
If you sold the break, the price extended to the low of 116.95. Happy days. However, executing the trade is job 1. The next job is to map out the direction and targets that give the next positive reinforcement that everything is going as planned.
In Figure 1 above, that next target would be the low from January 19. That low was a corrective low after the sharp move higher. If the price can get and stay below that level, it reinforces the break. It allows traders to adjust stops lower. It should lead to increased selling momentum too. Traders could then target the next levels on the downside.
What happened?
The next target can not be reached and the sellers turn to buyers. The price moves back above the 117.17 level and buying intensifies.
Should you stay with your initial short near 117.17? No. Get out.
NEXT PAGE: The Rule to Remember to Prevent Large Losses
|pagebreak|The “If…Should” Rule
I have a rule. It is called the “If…Should Rule”. It goes like this:
If the price does ABC, it should do XYZ. If it does not, get out
In the example, “If the price breaks below the 117.17 floor, the price should go lower and take out the previous low from January 19 at 116.92 (at least). If it cannot do it, get out.”
Where do you “get out” in this example?
This break should have been a pretty big break. There should have been sellers in the market who see the same thing and they should keep the pressure and momentum going. The market did not react that way. A move back above the 117.17 level is a clue to get out, take a small loss. Reevaluate. The trade did not do what you expected it to do. The market is greater than me. Get out.
Could you have gone long on the failure?
Sure. If it had all the reasons to sell and go lower on the break of the 117.17 level—and then it does go lower—that tells you something. If you realize this, you should be thinking of buying. If you did, you could have sold a few hours later against the 100-hour MA (blue line). Nice trade. You took an F on the report card and made it an A.
The same exercise is true for Tuesday’s fail (See Figure 2). This is basically the exact same trade. A similar failure and a similar move back to the 100-hour MA (blue line).
Wednesday, the opposite occurred (see Figure 3). In trading Wednesday, the Failed trade was on the break above the 200-hour MA. It was the first break above the MA level in a few days.
The topside trend line might be the next target.
The price could not stay above 200-hour MA. The high did not get close to the trend line. If the price breaks above the 200-hour MA, the price should find momentum and test the topside trend line. Nope.
If it fails and moves back below the reason to trade, get out. If you sold on the failure, the low extended to the 117.17-32 area and bounced (to the 100-hour MA, the old resistance level from Monday and Tuesday).
The lesson is that as traders we will experience failure. However, if you can recognize the failure by applying the “If…Should Rule,” you can, at the very least, prevent large losses and perhaps even turn an F on the trading report card into a passing grade.
By Greg Michalowski of ForexLive.com


