
Kaye Lee of StraightTalkTrading.com examines GBP price action leading up to the May 7 UK elections and presents a well-timed short position in this currency pair should it reach a given price range.
Whenever news events come around, traders always consider the potential currency impact, but did you know that the majority of speculators will usually show their hands just prior to the event? For proof, we turn to the daily chart of GBP/USD leading up to the UK general elections, being held on May 7.
Although at the time of writing, it is still relatively early—the positioning typically becomes clear in the few hours just before the event—the markets are already showing signs of this type of behavior.
GBP/USD Daily Chart
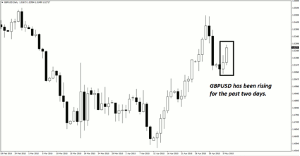
Click to Enlarge
We see signs of optimism as traders have gone long GBP/USD for the prior two days. Assuming the current situation continues into the election, the strategic trader will have to ask two questions:
- What will happen if the election turns out as the speculators expect?
- What will happen if it does not?
The good news is that the logical process is often the same. If the election turns out as expected, it is likely that most large speculators who have positioned themselves to go long GBP/USD will not buy more. It will be small traders who clamor for positions during that time. The currency pair may well rise, but the probability of it rising by a lot is slim.
On the other hand, if the election results do not meet expectations, cable will crash as traders rush for the door.
It is also entirely possible, of course, that expectations will be met exactly and the currency pair will not move at all. However, given that the market is prone to misperception during such events, this is unlikely. Thus, the best bet is usually to go counter to the direction of the most recent move just prior to, at the moment of, or just after the news event, which, in this case, is the election.
In addition, though, the usual technical set-ups must be fulfilled, and in this case, although GBP/USD does have certain possibilities, the more attractive set-up is occurring on four-hour chart of EUR/GBP, seen below.
This pair is showing a turning point (see blue box) in the area of 0.7485-0.7586, which was determined using a proprietary statistical method of anticipating potential turning points in price. However, many classical technical analysis patterns will likely produce levels in the general region.
EUR/GBP Four-Hour Chart
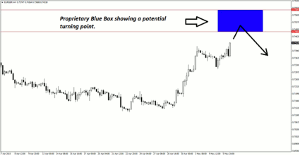
Click to Enlarge
The best possibilities for going short EUR/GBP would be offered on this four-hour time frame should it produce bearish price action including pin bars, bearish engulfing patterns, or bearish piercing formations, especially around the time of the election.
Traders should be aware that trading during events such as this may involve risk due to the widening of spreads and should account for the situation accordingly.
They should also consult their individual trading plans for precise entry and trade management rules. The blue box area on the above chart, however, will likely serve as a useful guide with regards to a beneficial entry point.
By Kaye Lee of StraightTalkTrading.com


