For the benefit of newbie traders, forex trading instructor Rick Wright, of Online Trading Academy, defines oscillators using the analogy of a child’s first set of training wheels and highlights the benefits as well as the drawbacks of these technical tools.
Over the past few weeks/months/years of teaching and writing these newsletters, I (and most of the other instructors) insist that price action is all you need to place your trades, looking for high quality supply zones to sell and high quality demand zones to buy. Sound familiar? However, many new students to our core strategy prefer to get started with a set of training wheels, if you will. This week I’ll explain how to use oscillators as your training wheels.
First, we need to define a couple of terms. The first is training wheels. When most of us first learned to ride a bike, trying to balance on two wheels was very difficult, especially when even just running was a clumsy challenge. So our parents attached a second set of wheels to the bicycle making it easier to stand upright. Over the course of a few days or weeks one of your parents (in my case my Dad) would slightly adjust the training wheels higher and higher off the ground, mainly to catch you if you fell over. As balancing on two wheels became easier, eventually the training wheels came completely off. An oscillator can be like a training wheel in trading, as you get more and more comfortable recognizing supply and demand you will probably remove it (or them) from you screen.
Now let’s define an oscillator. Investopedia defines an oscillator as:
“A technical analysis tool that is banded between two extreme values and built with the results from a trend indicator for discovering short-term overbought or oversold conditions. As the value of the oscillator approaches the upper extreme value the asset is deemed to be overbought, and as it approaches the lower extreme it is deemed to be oversold.”
As usual, I prefer to simplify things. When teaching oscillators, I prefer to use the terms cheap for oversold and expensive for overbought. The top defined portion of the oscillator range will be considered expensive and the bottom defined portion will be considered cheap. When choosing to add an oscillator to your decision process, please remember that supply and demand is much more important than some set of wiggly lines at the bottom of your screen. For this newsletter we will only use the Commodity Channel Index or CCI. Some oscillators range between 0 and 100, with overbought readings showing up between 80 and 100 and oversold readings between 20 and 0. The CCI is slightly different. It wiggles above and below the 0 line, with overbought readings commonly over 100 and oversold readings below -100. Yes, these readings can be adjusted as the trader sees fit; and the Internet is full of recommendations for the best settings. (That is sarcasm, by the way.)
So let’s look at a chart with the CCI applied and see if these training wheels can help.
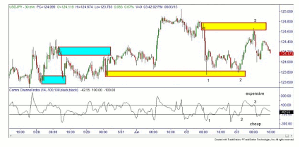
In this USD/JPY 30 min chart, I’ve marked in two supply zones and two demand zones. Let’s look at the yellow zones first. At the yellow demand zone where the number ‘1’ is marked, you can see that the CCI was well into the cheap area, which could have helped the new trader place a buy order. The same could be said about the spot marked ‘2.’ In the yellow supply zone at the spot marked ‘3,’ a new trader could have taken a short trade as the CCI was also in the expensive area. Pretty straight forward, right?
Now take a look at the two blue shaded zones. Can you spot where the buy and sell orders should have been placed?
Now step back a bit. Can you see how many trades that didn’t get triggered because the CCI wasn’t in the overbought or oversold areas? As I stated, this tool is good for a set of training wheels, as it may keep a new trader from placing too many trades while they get comfortable recognizing high quality zones; but you will certainly miss a few opportunities waiting for the CCI to get cheap or expensive.
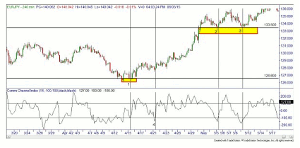
Another problem with many of these extra tools is the fact that in trending markets, especially strongly trending markets, the oscillator might not reach the cheap or expensive areas for a long time. In the chart above, the CCI was cheap in demand at the vertical line marked ‘1.’ (I’ve offset the vertical lines from the candles to make them more visible.) The next time you got an oversold reading while in a quality demand zone was way up at the numbers ‘2’ and ‘3!’ As you can see, if you missed the original entry, there were no clear setups for almost 700 pips. I did mark the one other time the CCI was cheap on the way up, but the demand zone certainly would not have met our criteria.
So, what is the bottom line? Like training wheels, these tools can be helpful, but over time we certainly expect them to be removed as you become more comfortable with supply and demand.
By Rick Wright, Instructor, Online Trading Academy


