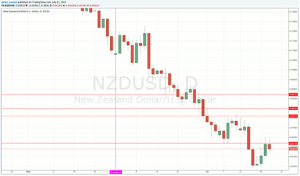
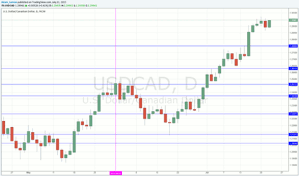
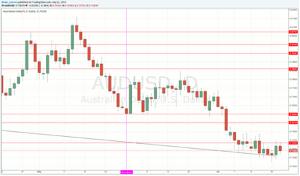
Statistically, over the last 15 years, the USD has not had a propensity to trend during June and July. However, Adam Lemon, of DailyForex.com, points out that this summer has played out differently and has seen the US dollar move hundreds of pips directionally against the NZD, AUD, and CAD.
Statistics show that entering trend trades during the summer months is a fruitless quest with a negative expectancy. The old cliché “sell in May and go away” seems to be based on cold hard facts. This summer has played out quite differently, with several strong and important trends in major assets having continued through June and July. Let’s take a look at what has been moving and try to find out the reasons why.
The US Dollar
Statistics for the last 15 years show that this currency has a stronger propensity to trend than any other. Not during the months of June and July, however. Most people consider the summer months to consist of June, July, and August. In fact, the months to avoid are only June and July, as entries in August can leave the trade well positioned to take off further into profit, provided they survive intact into September.
This summer has seen the USD move hundreds of pips directionally against the NZD, AUD, and CAD, which have all been weak currencies.
This is a little surprising, as although the USD was very strong throughout most of 2014 and also during early 2015, most of the economic data releases and commentary by the Federal Reserve did not strongly back such bullishness, with a couple of exceptions.
My view is that the USD continued to strengthen for two major reasons: firstly, although the fundamentals may not look 100%, the economic fundamentals of the US still look better than those of any other major currency country. Secondly, debt contagion fears, especially regarding Greece, have seen flows into the USD as a relative safety asset. I give more weight to the former factor than the latter.
Precious Metals
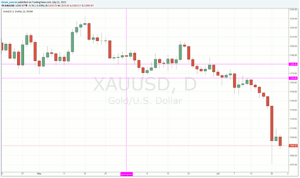
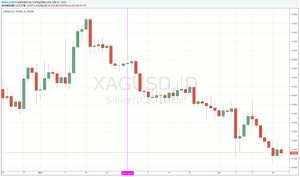
One analyst today remarked that “metals are the new Greece” and she did not only mean precious metals. June and July have seen serious falls in this category against the USD and against a basket of currencies in general.
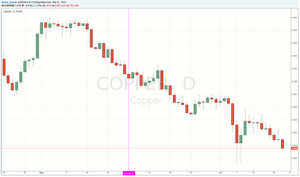
Since June 1, against the USD, Gold has fallen by 8.32%, Silver by a whopping 18.75%, and Copper by a whisker less than 11%.
Many analysts are puzzled by this fall in precious metals to new multi-year lows. After all, at a time of the widespread quantitative easing of currencies like the USD, it would be expected for any store of value such as precious metals are widely seen to be to rise in value against such fiat currencies like the USD and the EUR. However, the exact opposite has been the case this summer. I mentioned earlier—relating to the USD—that there was a perception of money flowing into safety assets, but that admittedly completely contradicts this fall in the value of precious metals.
NEXT PAGE: Sharp Drop in Price in USD Terms a Warning Sign?
|pagebreak|The large fall in copper is also seen as very concerning, because the demand for copper is seen as an indicator of the health of global manufacturing. A sharp drop in price by almost 11% in US dollar terms has been interpreted as a warning sign of an impending large drop in manufacturing production and has been cited as reason for concern that China is about to experience a massive economic slowdown.
Crude Oil
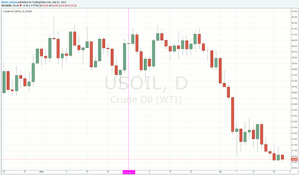
The second half of 2014 and the very first weeks of 2015 saw the price of Crude Oil fall by more than half of its value. Once that move played out, the conventional wisdom was that there was going to be a big bounce up. The price did indeed pullback by quite a large amount (from approximately $42 to $62). However, it then began to fall quite sharply again and since June its price is down by about 20%. Admittedly, this is not as big a change as the bounce up earlier in the year, but it is undoubtedly a meaningful fall over the summer months.
US Equities
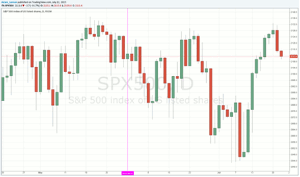
Finally, let’s conclude with one last asset: the S&P 500 (SPX), representing the global equity market in its simplest form here, by one single index. Interestingly, this shows a completely different story: since the first of June, the price of the Index is almost completely unchanged, from 2110 at open to 2112 at the time of writing this piece.
Taking a closer look at the chart below, we can see that the action was actually a widening-ranged bearish move until the market recovered over the last couple of weeks or so.
Although most analysts would agree that there has been a very strong technical bull market in US equities since around early 2012, or so, at least, and although certain key indicators like the golden cross have been maintained ever since then, the momentum of this long bull market is showing signs of running out of steam.
Multi-Market Analysis
What we see is the following:
- A fall in the price of commodities—including precious metals—and also economic assets such as copper and oil.
- A fall in the price of commodity currencies such as the Canadian, Australian, and New Zealand dollars.
- The US stock market is flat and possibly topping out after a very long and strong bullish move.
- Continuing strength in the US dollar.
If this combination is indicative of anything, it is of a forthcoming period of some retrenchment in economic growth.
By Adam Lemon, Contributor, DailyForex.com

