Since this currency pair is ground zero for risk sentiment and the forex market, Tyler Yell, of DailyFX.com, illustrates that by using a combination of technical analysis, sentiment, and volume, a forex trader might get a better understanding of what is likely to happen in the future for the pair.
Talking Points:
- AUD/JPY Is Ground Zero for Risk Sentiment in the FX Market
- AUD/JPY Sentiment and Volume Favor Trend Continuation
- AUD/JPY Technical Analysis Provide Targets for the Downtrend
AUD/JPY is ground zero for risk sentiment and the forex market. Each currency in the pair displays one emotional view polar opposite to the other. The Australian dollar is heavily bid in times of economic growth and expansion where interest rates are on the rise and traders are seeking and buying higher yielding currencies while selling lower yielding currencies in a classic carry trade play.
On the other side of the spectrum, the Japanese yen is the secular risk-off currency. Because of the low interest rates held by the Bank of Japan, the Japanese yen is often sold when risk sentiment is on the rise in order to seek greener pastures and higher yields. However, when the global risk tree is shaken so that many of the speculators fall out, the yen is often forcefully bought back causing sharp moves higher. When the yen strengthens, rarely are the headlines on DailyFX going to make you feel good about the near-term economic future.
For these reasons above, it is important to know the direction of AUD/JPY. If AUD/JPY is heading higher, there are often ripple effects in other markets of risk taking at expanding rates. If AUD/JPY is moving lower—and when it does it is often aggressive—there are often ripple effects and other markets of profit-seeking capital being taken off the table in order to preserve that capital from dropping further.
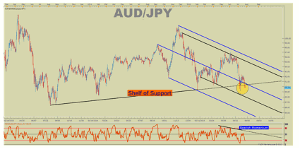
AUD/JPY Recently Broke Through Shelf of Support Warning of Further Downside

(Created using Marketscope 2.0 charts)
Click to Enlarge
In order to gain a full understanding of what’s happening in this important pair, we will turn to sentiment and volume to add to our understanding of what is happening on the charts. This combination of technical analysis, sentiment, and volume should provide us a better understanding of what is likely to happen in the future. If you are unfamiliar with sentiment and volume, here is a quick explanation on how this article will look at these circumstances moving forward.
Retail Sentiment: Most often, SSI will help you see the beginning of a new trend, which is historically fought by the retail trading crowd.
Retail Volume: Real Volume is a default indicator that can be added to your charts. Volume is used by Institutional FX traders as well as traders from other markets to understand market participation in a move.
NEXT PAGE: What Do the Larger Technical Pictures Favor?
|pagebreak|What Volume and Sentiment Say About AUD/JPY

(Created using Marketscope 2.0 charts)
Click to Enlarge
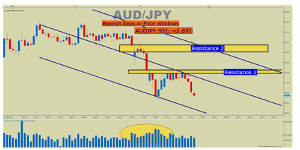
Have you heard of the phrase,’ sell in May and go away’? It appears that AUD/JPY have and did. Looking at a daily chart over the last three months, AUD/JPY pushed higher from early February to May before falling aggressively by 800 pips over the summer with the potential to keep pushing lower. Should this continue, this would spell out a dire warning for risk sentiment in FX and other markets.
As you can see above, AUD/JPY has moved aggressively lower with two gaps highlighted on the chart above marking key resistance in a downtrend. Additionally significant, you can notice that the gaps developed on a relatively high volume. High volume in a move with the trend shows market endorsement of the move and the continuation in the direction of the breakout with high volume is likely.
Secondly, at the top of the chart, you’ll notice the speculative sentiment Index reading of AUD/JPY of +2.697. This reading shows a strong majority, nearly 75% of retail open positions are buying and fighting this trend. We use our SSI as a contrarian indicator to price action and the fact that the majority of traders are long gives signal that the AUD/JPY may continue lower.
The combination of volume and sentiment favors further downside. As a contrarian indicator, speculative sentiment Index shows retail traders are fighting this trend and have been doing so unsuccessfully over the summer. From a volume perspective, momentum and endorsement of the move lower is gaining steam. Now, let’s add technical analysis to the picture to round up our view.
The Larger Technical Pictures Favors Short Sellers

(Created using Marketscope 2.0 charts)
Click to Enlarge
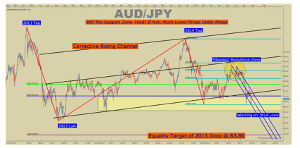
When considering technical analysis, AUD/JPY is showing extreme weakness by recently pushing 2014 lows. The sharp falling blue channel on the right has framed a majority of price action since the June 2014 lower high of AUD/JPY. This channel has taken us below the corrective rising channel labeled on the chart above and the break—along with volume and sentiment mentioned earlier—favors further downside.
Another tool, Fibonacci ratio analysis, provides targets based on prior moves. The sharp, five-month move in AUD/JPY in 2013 will likely influence the drop we're seeing from the 2014 top to whatever low we’re working on now. If the moves are similar, this current move would have another 660 pips to the downside, taking us from 90.432 around 83.80. Of course, there’ll be retracements and confusion along the way, but as long as the price stays within the falling blue channel and lower highs continue, downside targets will be preferred over a reversal.
Potential Trading Plan
Lower highs in a downtrend are very helpful for managing risk. The recent lower high in early July of 92.45 can act as a short-term invalidation of eminent downside. As you can see in the chart above, the highlighted rectangle shows a thick zone of support that may be difficult to break. Bounces often happen near prior extremes and if you’re trading a market that has bounced near a prior extreme, be on the watch out for reversal.
Currently, the RBNZ loosened two of last year's four hikes and it says further easing is probable. The growth outlook has deteriorated since June. Fundamentally, this will likely add to the ~16% decline we’ve recently seen.
Validation Level:
Stop: Close > 92.45 July 15 Lower High / Gap Resistance
Target 1: 88.20 (2014 Low)
Target 2: 83.80 (Equal Wave Target of 2013 Drop from 2014 Lower High)
Alternative Scenario: If the July 15 high on AUD/JPY is taken out, watch for JPY to be a better sell against some of the stronger currencies such as GBP, USD, or NZD. A positive surprise to the global growth picture could bring this move into picture. Currently, this seems improbable.
By Tyler Yell, Trading Instructor, DailyFX.com


