Walker England, of DailyFX.com, takes a technical look at this currency pair that moved lower on Canadian GDP Data on Tuesday and suggests that forex traders looking for a bearish breakout continue to monitor this pivot point, while in the event of a bullish reversal, to watch for a move back through this particular trading range.
Talking Points:
- The USD/CAD moves lower on Canadian GDP Data
- Tuesday’s range measures 116 pips
- R4 breakouts begin at 1.5477
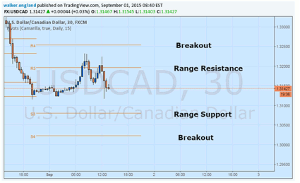
USD/CAD 30Minute Chart

(Created using Trading View Charts)
Click
to Enlarge
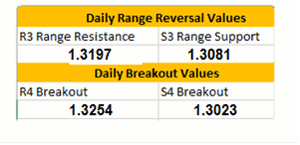
The USD/CAD has moved off key points of resistance this morning after the release of Canadian GDP data for the month of June. Year-over-year, GDP was expected to be released at .4%. However, with a better than expected print of .6%, the CAD has quickly rallied against the USD and other major currencies. This has caused the pair to move back inside of Tuesday’s 116 pip trading range, starting with a drop below the R3 Camarilla pivot at 1.3197. If prices continue to decline, the next major value of support is found at 1.3081, represented by the S3 pivot displayed below.
If prices continue to decline below the S3 pivot, it is worth noting that prices have closed down in the previous four trading sessions. Traders looking for a bearish breakout should continue to monitor Tuesday’s S4 pivot point found at 1.3023. A move to this point would add validity to the USD/CAD’s decline on the creation of a new lower low. Alternatively, in the event of a bullish reversal, traders will watch for a move back through the previously mentioned trading range, as well as attempt to break above the R4 pivot found at 1.3254. In this bullish scenario, it should be recognized that the current downtrend would be considered at least temporarily invalidated.
Intra-day USD/CAD Support and Resistance Values for Reversals
By Walker England, Trading Instructor, DailyFX.com


