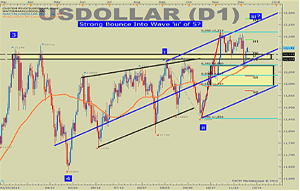
While the commodity slump continues, as Tyler Yell, of DailyFX.com, technically points out, the USD has benefited, having moved aggressively higher after a sell-off last Thursday. Tyler also highlights the bull flag pattern that appears to have formed and shares his outlook for the greenback heading into yearend.
Talking Points:
- US Dollar Technical Strategy: Technical Strategy: Strong Bounce Off 38.2% Fibonacci Favors Strength
- USD Benefits As Commodity Slump Continues
- Lack of Fundamental Data Until Friday Turns Focus on Sentiment and Respective Strength
The USD has moved aggressively higher off the 55-day moving average after an aggressive sell-off last Thursday. In addition to the 55-day moving average, the current pivot in price aligns with the 38.2% Fibonacci retracement level of the October-November range of 11,854-12,219. In a world of fractal markets, (where a smaller pattern mirrors a pattern on a larger time scale) we appear to have traced a similar corrective pattern that ate up 28-trading days from September 4 high from the August Payroll beat to the October low on the 15th of the month. If this pattern holds, the implication would be that we could now be set to retest and potentially break the November-December highs of 12,212-12,219.
Looking at the chart, you can see we’ve back above the key support from the March 13 closing high of 12,127 to the late September corrective high of 12,104. The top of the range aligns with the Weekly Pivot point, and will currently act as support. Should the support fail to hold, we can now confidently look to the 55-day moving average—currently at 12,074—to act as support on the close as it did on December 3 and 4. The pattern that we’re currently tracking is a Bull Flag, which is a trend continuation pattern. The validation of the Bullish argument would take hold on a break of the Weekly R1 at 12,185 followed by the December high of 12,212.
In addition to the Bull Flag, technical analysis per Elliott Wave shows that we could be setting up for an aggressive third wave higher after the corrective wave finished on December 3. A third wave ( of five waves in the direction of the trend) is expected to be the most extreme or strong of the trend advancing moves and could easily move us into new highs to begin 2016. The risk: reward favors a long bias with an invalidation below the December 3 low looking toward new highs. To achieve targets beyond the 2015 extreme, we can look to the Weekly R2 Pivot at 12,275. 12,275 also aligns with 138.2% extension of the November-December Range, which adds validity as an upside target.
By Tyler Yell, Trading Instructor, DailyFX.com


