Since this currency pair is retracing this week after advancing as much as 561 pips from the start of February, Walker England of DailyFX.com suggests that currency traders looking to validate this uptrend can turn to this indicator.
Talking Points
- The EUR/GBP Has Advanced as Much as 561 Pips for February
- Bullish Daily Breakouts Began Over .7789
- SSI is Bullish, Reading an Extreme -2.99
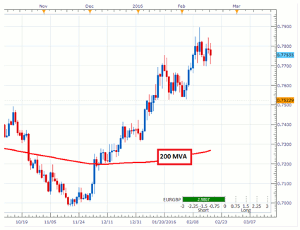
EUR/GBP Daily Chart

(Created using Marketscope 2.0 Charts)
Click
to Enlarge
The EUR/GBP is retracing this week, after advancing as much as 561 pips from the start of February. Traders looking to validate this uptrend can look to the 200-period MVA (Simple Moving Average) which is now trading 488 pips below Thursday’s price action. It should also be mentioned that SSI (Speculative Sentiment Index) is also reading at an extreme for the pair. Currently SSI is positioned at -2.99, which stipulates that there are nearly three positions short for every one position long. When taken as a contrarian signal, this SSI reading can also be used to validate the markets current uptrend.
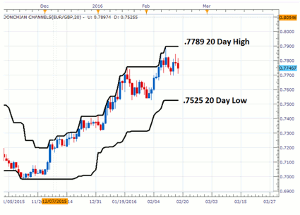
EUR/GBP Daily Chart

(Created using Marketscope 2.0 Charts)
Click
to Enlarge
Traders looking to trade a breakout can plan to enter the market on a new daily high. As seen in the graph above, the current daily high resides at a price of .7789. To help identify potential entry orders into the market, traders may choose to use a 20-period Donchian Channel. To read the entire article, click here…
By Walker England, Trading Instructor, DailyFX.com


