
The pullback to multi-month lows in the CBOE Market Volatility Index — or VIX — proved to be an opportune time to hedge long positions. That is, if the decline in equity’s last week continues in both duration and/or magnitude, asserts Todd Salamone, technical expert and senior vice president of research at Schaeffer's Investment Research.
In fact, as you can see on the chart immediately below, after the VIX peaked at 40.28 in October (a level 200% above its 2019 close), it has found support at the 20.14 area, which is not only half of its October closing high, but also an area that is roughly 50% above its 2019 close of 13.78.
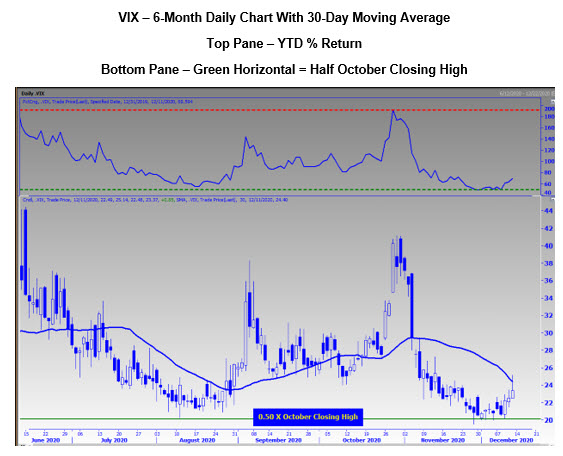
As a side note, I have been monitoring the VIX’s 30-day moving average for the past several months, as I find it intriguing. Most interesting of late is the “fear gauge’s” Friday failure at this declining moving average -- which could be hinting that the VIX’s pullback will be shallow.
Last week’s pullback may not have been a huge surprise, given the sentiment-based risk, and especially, if you have been in touch with the weakness stocks typically experience in the first half of December.
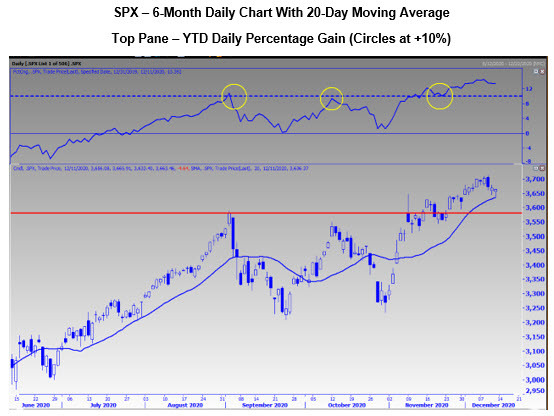
Plus, multiple equity benchmarks are simultaneously flirting with round-number psychological resistance levels such as the 3,700 level on the S&P 500 Index (SPX), the 30,000 area on the Dow Jones Industrial Average (DJI), and the $300 level on the technology-heavy Invesco QQQ Trust Series (QQQ) exchange-traded fund.
Last week’s decline was hardly enough to get the bulls’ attention, as the SPX did not break below its 20-day moving average and remains above November’s close of 3,621.63 (implying it remains positive during a normally weak, two-week period). Even if these levels were to break, there is potential support in the 3,550-3,580 area.
We are now entering a historically bullish seasonal period for the SPX, as the second half of December historically produces bullish price action. (If the SPX closes the first half of the month positive, but by less than 2%, the expectation would be a lower-than-average return in the second half.)
A weaker-than-average second half of December would not be a huge surprise, given the optimism that continues to prevail among short-term traders. This suggests positive news is being factored in, leaving the market more vulnerable-than-usual to negative headlines.
We are entering a period of bullish seasonality and the technical backdrop continues to confirm the optimism that we are seeing among short-term traders. But this optimism presents a risk to the bullish case, so keep your hedges in place.
Small caps may be the biggest area of opportunity, as measured by the iShares Russell 2000 ETF (IWM) and Russell 2000 Index (RUT). With the IWM and SPY experiencing about the same performance in 2020, there is much more short-covering potential in the small-cap area relative to large-cap stocks.
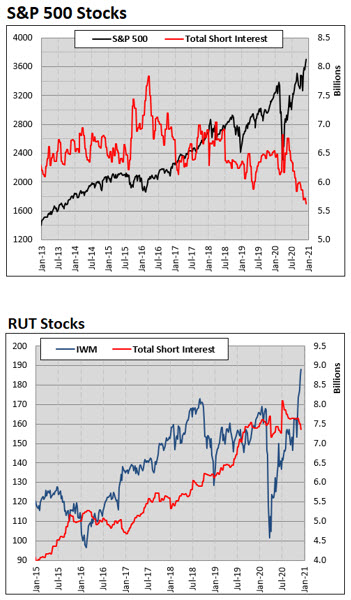
Note in the graphs above that SPX component short interest is at a multi-year low after significant short covering since the middle of the year.
There has been short covering in the small-cap space since July too, but note how total short interest on components of the RUT is still nearer to multi-year highs, suggesting the shorts could be in the early innings of covering.


