Xerox (XRX) is a legendary name in U.S. business; the company made a fortune selling office equipment like printers and copy machines, notes Richard Suttmeier, technical expert and editor of 2-Second Trader.
Today, the Connecticut-based company has a market capitalization of $4.7 billion. It rakes in around $9 billion a year selling equipment and services to corporate customers.
A few weeks ago, Xerox posted fourth quarter earnings that came in slightly below analysts' expectations. Nevertheless, shares of Xerox held up well, as the company offered a positive outlook for 2021.
Xerox is trying to drive new growth by focusing on cybersecurity applications. This year, the company plans to add workflow automation, machine learning, artificial intelligence, and other remote services.
These services will improve the efficiency and security of its clients' businesses. Xerox should also benefit from an improving economy later this year. Most economists expect solid growth in 2021.
Looking at the technical picture, shares of Xerox are trading almost 40% below their pre-COVID highs of a year ago. If the stock rebounds from current levels to its semiannual risky level at $29.35, we'll be able to book a gain of around 22%. That's the minimum upside.
Longer-term, Xerox could rally up to its annual risky level at $37.98. If I'm right, we could generate a 60%-plus gain on this trade.
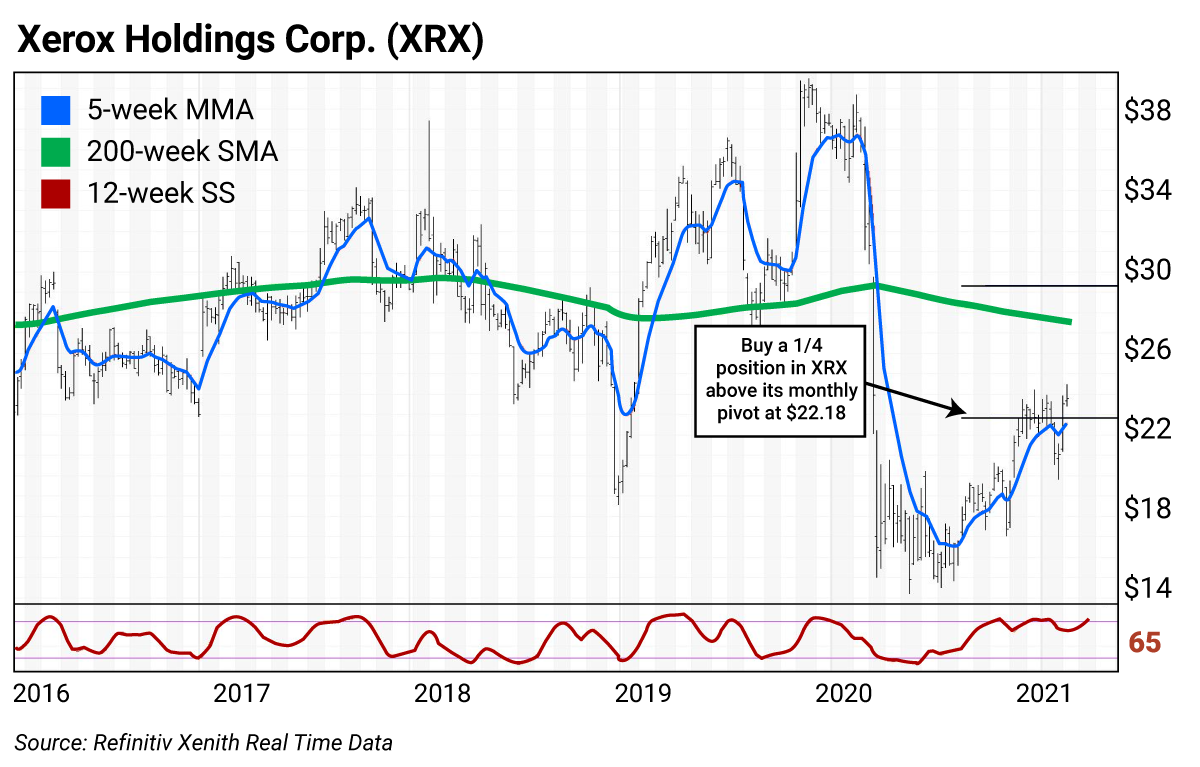
Let's take a look at the weekly chart. The blue line through the price bars is its five-week modified moving average (MMA), now sitting at $22.56. The green line is the 200-week simple moving average (SMA), currently at $27.56.
As you can see, Xerox traded back and forth around its 200-week SMA in recent years. Its multi-year high of $39.47 was set in November 2019. From this high to its May 2020 low of $14.22 the stock plunged 64%.

Based on the technical setup, Xerox is a great play for a "reversion to the mean" trade. It's highly likely that Xerox eventually rebounds to its 200-week SMA. That would give us a quick 17% gain from current prices.
I've also included the monthly value for Xerox. As you can see, the stock is trading just a few percent above the line at $22.81.
The red line across the bottom of the chart is the 12-week slow stochastic (SS) reading. The reading scales between 0 and 100, with readings above 80 indicating a stock is overbought and readings under 20 meaning it's oversold.
Xerox has a 12-week SS reading around 65 right now — a little above the middle of the range. More importantly, the SS reading is rising.
The other important signal comes from the five-week MMA, which is currently at $22.56. In other words, Xerox is trading just above its five-week MMA.
This combination of signals — a rising 12-week SS and trading above the five-week MMA — is my favorite technical setup for a trade. Our Black Box tool shows upside targets at three different levels: the semiannual, quarterly, and annual risky levels at $29.35, $32.14, and $37.98.


