The Cboe Volatility Index (VIX) closed below 20 last week for the first time in almost a year. The 246 days above 20 was the second longest streak above that level ever, observes Rocky White, senior quantitative analyst at Schaeffer's Investment Research.
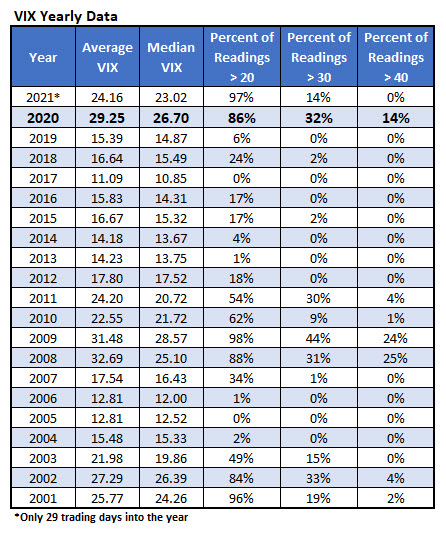
We have data on the VIX back to 1990. The table below summarizes the VIX closes on a yearly basis over the past 20 years. The VIX average close in 2020 was just above 29, which was the highest average since 2009 -- the bottom of the financial crisis. The VIX closed above 20 86% of the days last year, which also marks the highest since 2009.
This week, I’m looking at how stocks have tended to perform after the VIX closes below this even level.
After the First Close Below 20
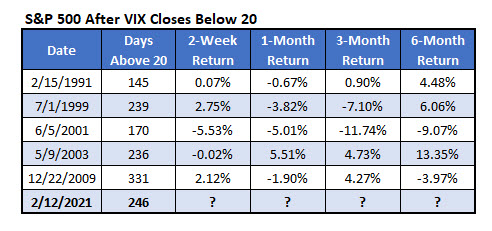
There have only been five other occasions when the VIX spent at least six-straight months above 20. The table below shows each time the index fell below that level after those streaks. The last occurrence came at the end of 2009, as stocks recovered from the financial crisis. The S&P 500 Index (SPX) chopped around after this, with the index up over 4% after three months but down almost 4% after six months.
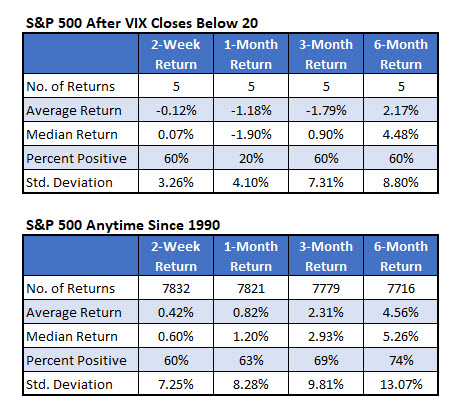
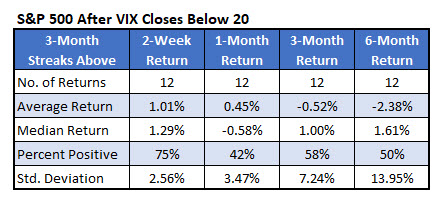
The table below summarizes the one above and compares the returns to typical S&P 500 returns. On average, after these five events, stocks tended to struggle. A month after the VIX finally broke below 20, the S&P 500 was up only one time a month later with an average loss of 1.18%. Stocks averaged a loss at each time frame except six months which showed an average 2.17% gain compared to a typical anytime return of 4.56% over six months.
These next tables tell us what to expect from the VIX, or at least as much information as you can garner from five data points.
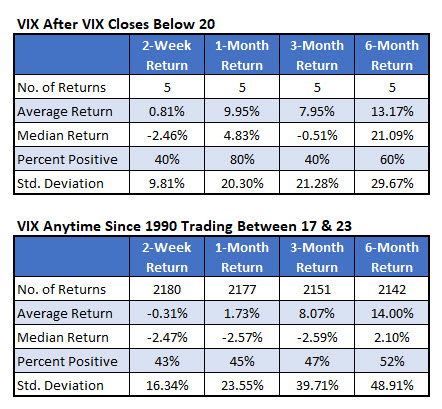
For the comparison table, I only showed how the VIX did after closes around the 20 level. I think it’s the best comparison, as you expect the VIX to act a lot differently at 20 than when it’s closer to 10 or 30. The VIX has typically increased over the next month after these signals.
That’s expected, considering the poor performance of the S&P 500 over that time frame (remember the VIX tends to move in the opposite direction as stocks). The longer-term time frames, three and six months, show an average return that’s close to what you would generally expect from the VIX.
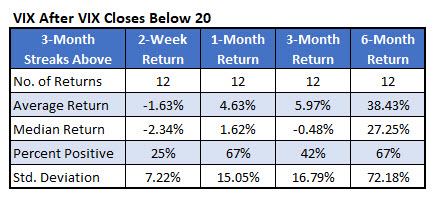
I decided to lower the threshold from six months above 20 to three months. This gives us 12 signals to summarize instead of just five. The table below shows these signals have led to an underperforming market. Six months after these signals the S&P 500 averaged a loss of 2.38% with exactly half of the returns positive.
And below I summarize the percentage changes in the VIX after these signals. As expected, it acts opposite of the S&P 500. Stocks, according to the table above, did well over the next two weeks so the VIX fell an average 1.63% and was positive just 25% of the time. Six months after these signals, the VIX went up on average 38% with 67% of the changes positive.
Extremely Strong Markets
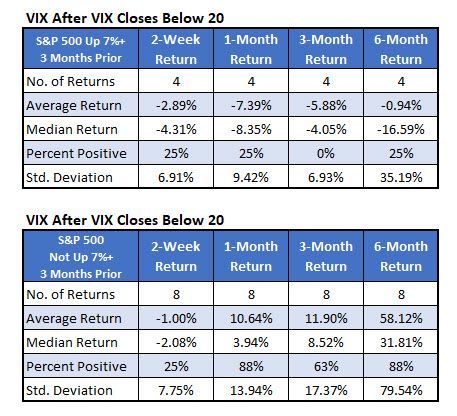
Finally, I broke up the returns in the table above by the strength of the market over the preceding three months. Before this latest signal, the S&P 500 has gained just above 10%.
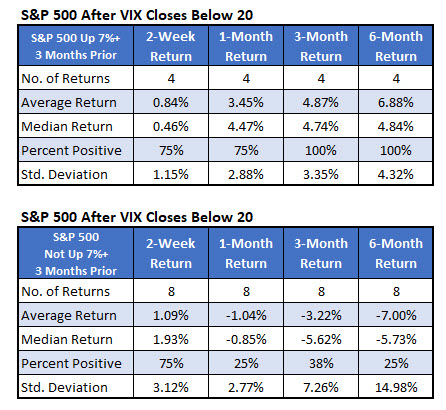
The first table below shows that when the index has gained at least 7% in the three months before a signal, the S&P 500 went up all four times over the next three months with an average gain of 4.87%. Over the next six months, the index gained 6.88% on average with every return positive.
Compare that to when the three-month return of the S&P 500 was less than 7%. It was those instances that the underperformance was prominent. The number of data points makes it impossible to conclude with certainty that momentum is likely to continue after these streaks end in extremely strong markets. But the numbers we have lean in this direction.
The VIX numbers in the table below are what you would expect given the numbers above. The VIX has tended to go down after these streaks end in very strong markets like what we have now. Otherwise, it has tended to go up.