
Uranium has been one of the top performing assets recently. Demand spiked just after we picked up some positions in NexGen Energy (NXE) and Uranium Royalty Corp. (Vancouver: URC), suggests Omar Ayales, resource sector specialist and editor of Gold Charts R Us.
And although uranium has been one of the best trades this year, it'll likely remain in a bull markets for the years to come. The vastness of uranium as a solution for our society’s energy demand seems like the best alternative to fossil fuels due to its low cost and safety.
We picked up some NXE at the low near $3.25 just before it started taking off. Notice the leading indicator below the chart breaking out, with room to rise further. NXE is telling us a renewed upmove could be starting. A break above $4.25 confirms strength. Keep your positions.
Uranium Royalty is another of my favorites. We did great trading in this stock earlier this year achieving triple digit returns in just a couple of months. Uranium Royalty is once again showing signs of strength. We picked up some at the recent lows.
Our technical indicators suggest the stock is breaking out and showing upside potential. Watch for a clear break above $3.25 to confirm strength. We have small positions in both Uranium Royalty and NexGen Energy and we'll be looking to add on any weakness.
Meanwhile, one of the charts I like really like that provides good insight to momentum flow is the Industrials to Utility ratio on the chart together with its leading indicator below. The ratio measures strength of Industrial companies relative to Utility companies.
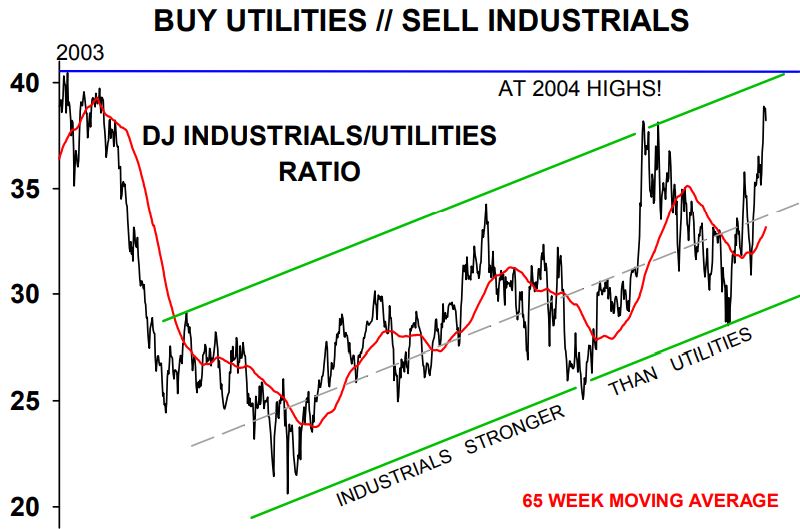
You’ll remember industrial companies tend to be associated with risk assets while Utilities are a safe haven of sorts. This means, when the ratio rises in favor of the Industrials, it suggest sentiment favors risk. Conversely, when the ratio declines it favors the Utilities, suggesting sentiment favors safety.
You’ll notice for the past 2 years, the Industrials have been outperforming the Utilities. Notice the ratio is reaching the top side of the 10+ year upchannel.
Moreover, notice every time this top side has been reached, a decline has ensued. That is, the weaker utilities are taking over the better strength from the industrials stocks.
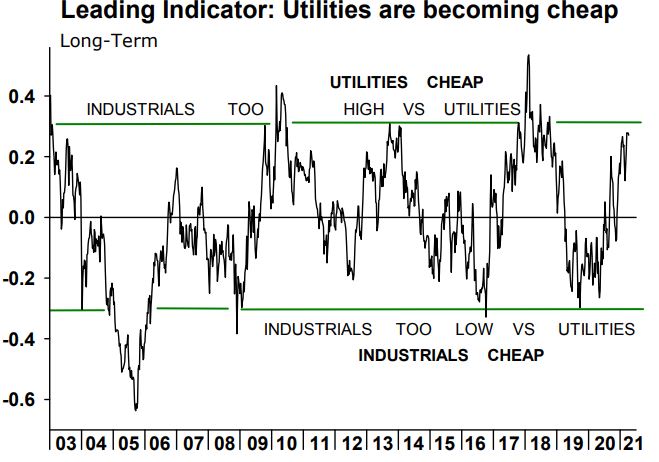
The leading indicator below is also reaching an extreme, suggesting utilities are becoming cheap versus industrials. The ratio could still develop further in favor of industrials, but it’s reaching maturity. This chart is telling us to sell industrials and buy utilities.
As such, we started last week buying some Consolidated Edison (ED). The utility is confirming support at the March 2020 lows. It’s reaching the 2021 highs now.
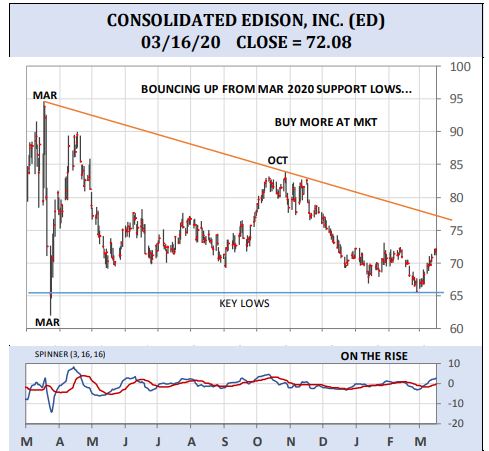
Spinner — our technical indicator — is rising above zero, showing momentum picking up steam. If ED can break above the March downtrend on a 2-day close above $77, it could then rise to the 2020 highs near $95. Keep your positions, buy more at market.


