
Investors in today’s stock market have become intoxicated on the Federal Reserve’s unprecedented — and seemingly endless — easy money policy, notes Jim Stack, a leading safety-first money manager and editor of InvesTech Research.
And in March, Fed officials all but promised to keep the party going in spite of potentially dangerous consequences from developing asset bubbles.
One might say this uncharted course began over two years ago in December 2018 when the stock market suddenly tumbled -9.2% in the worst December loss since the Great Depression.
Out of fear, the Federal Reserve immediately reversed its hawkish rhetoric and shortly thereafter started unwinding its previous nine Discount Rate hikes.
The easing continued, in spite of no firm evidence of recession, until the COVID-19 pandemic struck last year and Fed officials made the final panic cut in short-term interest rates to 0%.
This sloshing 180-proof liquidity has fueled some of the most speculative nonsense in market history — including record high margin debt, an IPO mania that dwarfs most predecessors, esoteric digital art called Non-Fungible Tokens (NFTs) that sell for millions, and a Cryptocurrency craze that is starting to resemble the Tulipmania of the 1600s — including two latest crypto-trader favorites: $ASS Coin and PooCoin.
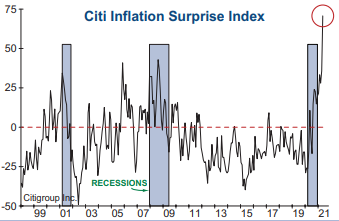
Unfortunately, aside from lofty stock market valuations and another probable housing bubble, this excess liquidity has also fueled unexpected inflation pressures, as Citigroup’s “Inflation Surprise Index” has soared to a 23-year high. Yet the Fed Chairman remained resolute in keeping the punch bowl full.
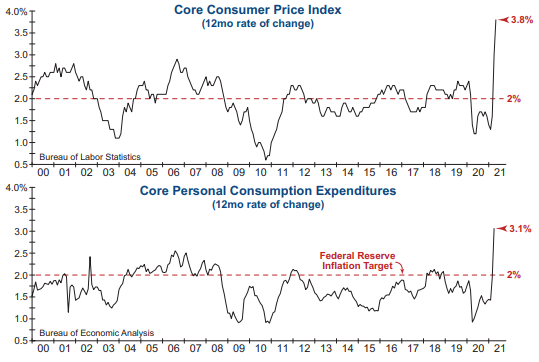
To say that the Federal Reserve has overshot its inflation target might be considered a historic understatement! The Core Consumer Price Index, which excludes volatile food and energy prices, has surged to 3.8% — the highest level since 1992!
Likewise, Core Personal Consumption Expenditures (the Fed’s preferred inflation measure) has surged well past the central bank’s 2% inflation target to 3.1%, causing many to wonder how hot inflation has to run before the Fed will intervene.
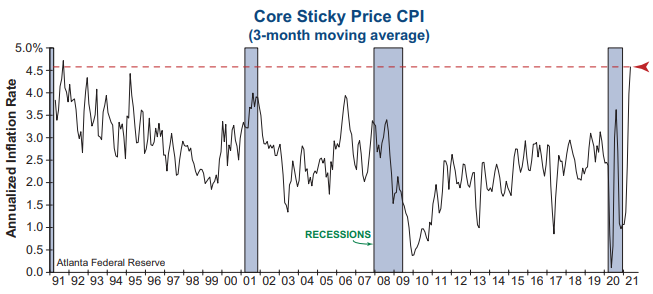
The greatest unknown, as well as the most important risk ahead, is whether today’s surge in inflation will be transitory or more lasting. To help answer this question, we turn to a tool provided by the Atlanta Fed known as Core Sticky Price CPI.
This measure tracks goods and services that change in price relatively infrequently, such as medical care, car insurance and repair, dining out, alcoholic beverages, and owners’ equivalent rent.
Core Sticky Prices have shot upward to an annualized rate of 4.6% over the last three months, which is the highest level in 30 years.
While we acknowledge there are aspects of today’s inflation that will moderate as the current supply chain problems resolve, this indicator highlights that there are major areas of inflation that will likely be more persistent. Thus, we have to seriously question whether this spike in inflation will be temporary.
The “stickiness” of inflation is also carrying over into the business world. The National Federation of Independent Business (NFIB) surveys small business owners each month about their future pricing plans.
Currently, a net 43% of small business owners are planning to raise prices in the next three months, which is the highest percentage since the double-digit inflation era of the late 1970s. These mounting pricing pressures are being driven by the need to pass on rising input and labor costs.
Inflation has to be weighing on the minds of consumers, as they have become keenly aware of the recent surge in prices. Each month, the University of Michigan conducts a survey of consumers by asking them a barrage of questions about the economic environment. This indicator not only provides information about the sentiment of the U.S. consumer but also more detailed reasons behind their answers.
In all three of these major categories — Housing, Vehicles, and Durable Goods– consumers cited high prices as a key reason that buying conditions have become less favorable. In fact, the percentage of responses that mentioned prices being too high in the housing market reached an all-time record high, nearly doubling the value seen in the last housing bubble!
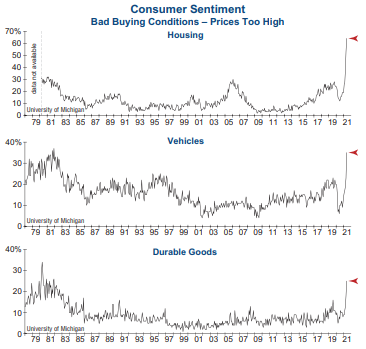
Not only are these data points eye popping, they also speak to the behavioral aspect of inflation and how it can adversely affect individual purchasing decisions. More importantly, these indicators highlight the increasing possibility of inflationary psychology gaining a foothold for the first time in decades.
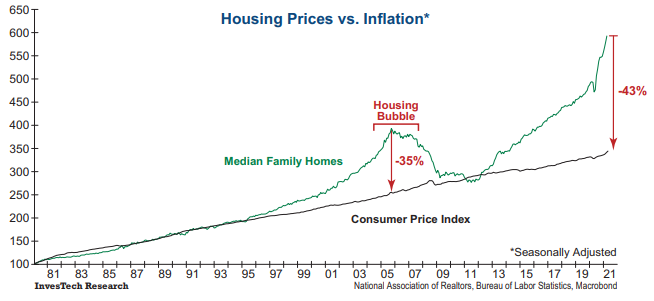
Meanwhile, our concern about a developing housing bubble has grown a lot worse over the past year. Such concerns arise from the fact that housing prices have historically tracked closely with long-term inflation, and that is currently not the case.
The graph below shows the massive divergence that existed during the Housing Bubble from 2005-2007, and the painful resolution as housing prices collapsed in the Great Recession.
While the extremes in subprime mortgage debt are not as evident in the current real estate market, the lack of affordability and today's dependence on record-low interest rates is potentially more dangerous.
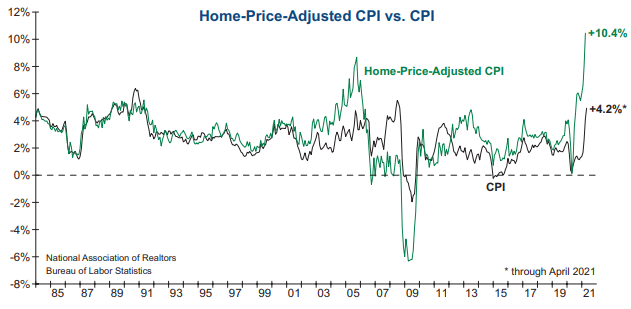
We would also remind investors of the move by the Bureau of Labor Statistics in 1983 to substitute “owners’ equivalent rent” (OER) for home prices in the calculation of CPI. This was originally intended to mitigate the dominant impact of rising home prices on inflation during the 1970s.
This adjustment to CPI successfully muted reported inflation, but it has significantly understated the inflationary pressures being felt by Main Street. For example, the government’s measure of OER has risen only +2% over the past year, while median single-family home prices have increased a whopping +20% over the same period!
The graph below shows the hypothetical difference between a CPI calculation that uses the actual median family home price and the currently reported CPI using OER.
The current Home-Price-Adjusted CPI reading calculates at a remarkable +10.4%, meaning that for today’s homebuyers the level of inflation captured in reported CPI is the most understated since the transition to OER!
At the midway point for 2021, the economic reopening and recovery has been stronger than virtually anyone predicted.
While this is certainly good news, we are concerned with the incredible amount of liquidity provided by the Fed and Treasury that is driving red-hot housing prices, equity market speculation, and inflation (too many dollars chasing too few goods).
Some of the data and graphics in this issue are alarming, especially for those who are becoming increasingly worried about inflation in their everyday life. Our objective is not to scare you, but to keep you informed and to provide guidance on managing your portfolio through the uncertainty ahead.
Skepticism can be a healthy trait when it comes to stock market investing. Yet it is also most often a learned trait that comes only after painful bear market and recession lessons.
So it is that we remain skeptical about the Federal Reserve’s continuing assurance that today’s inflation pressures will prove to be “transitory.” We know too much about history, and the evidence inside is simply not stacking up in the Fed’s favor.
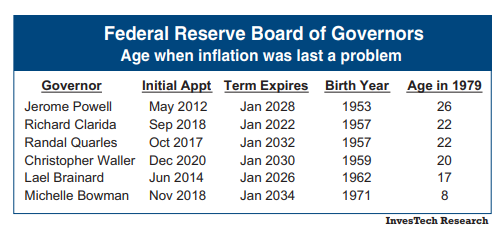
The progressively higher inflationary cycles of the 1960s and 1970s are long forgotten except in textbooks or by those old enough to remember. And the fact that none of the current members of the Federal Reserve Board of Governors — including Chairman Jerome Powell — were over age 26 when inflation was last raging doesn’t instill any higher degree of confidence.
We don’t believe the double-digit inflation experienced in the 1970s or early 1980s is right around the corner. However, the psychology is beginning to shift, and there is a risk that inflation could prove to run hotter and stickier than the Federal Reserve hopes, forcing them into tighter monetary policy sooner than they have telegraphed.
This type of environment requires a specific investment mindset that hasn’t been needed in a very long time.
While the Model Fund Portfolio has been positioned for the possibility of an inflationary outcome over the past year, our latest incremental adjustments are focused on rotating further toward holdings that not only capitalize on the economic recovery, but also tend to benefit in an inflationary environment.
International equities provide an opportunistic way to invest in the post-pandemic recovery while helping to address valuation and inflation.
Additionally, the Energy sector is positioned to capitalize on increased demand associated with the recovery and tends to perform well during periods of sustained inflation due to the inherent inverse relationship between the U.S. dollar and crude oil.
We are recommending an increase in our allocation to the MSCI ACWI ex-U.S. SPDR ETF (CWI). International stocks provide an inherent hedge against depreciation of the U.S. dollar while also addressing valuation risk.
We also recommend an increase in our allocation to the Energy Select Sector SPDR ETF (XLE). The Energy sector provides commodity exposure which can benefit in an inflationary environment.
While resilient technical evidence still supports giving this bull market the benefit of doubt, we remain vigilant in monitoring increasing risks.
Our Model Fund Portfolio — which remains 80% invested— carries a blending of both cyclical and defensive sectors, enabling it to participate in an inflationary environment while also protecting against downside risk. And our 20% cash/treasury reserve is a prudent buffer against the increasing volatility that we see ahead.


