
There’s nothing like zooming out to get a wider perspective, asserts Peter Krauth, editor of Silver Stock Investor — and a participant in Money, Metals & Mining Virtual Expo on August 24-26. Register here for free.
It’s often too easy to just focus on daily, monthly, or even yearly data for a particular asset to understand what might come next. And no matter how you slice it, silver is exceedingly cheap. This chart shows the silver price over the last 50 years.
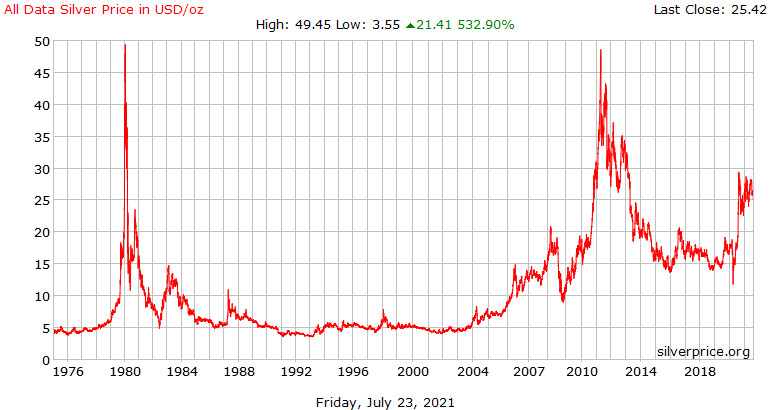
Source: silverprice.org
We can clearly see that in that time frame, silver has twice flirted with the $50 level, both in 1980 and 2011. And despite 41 years having passed since silver’s first peak at $50 in 1980, silver is still currently 50% below that all-time nominal high. It’s incredible to think that after so long and so much fiat money printing that silver is still so cheap.
Now let’s look at the silver price adjusted for inflation. In my view, this is more realistic, because naturally prices for practically everything rise over time as input costs rise.
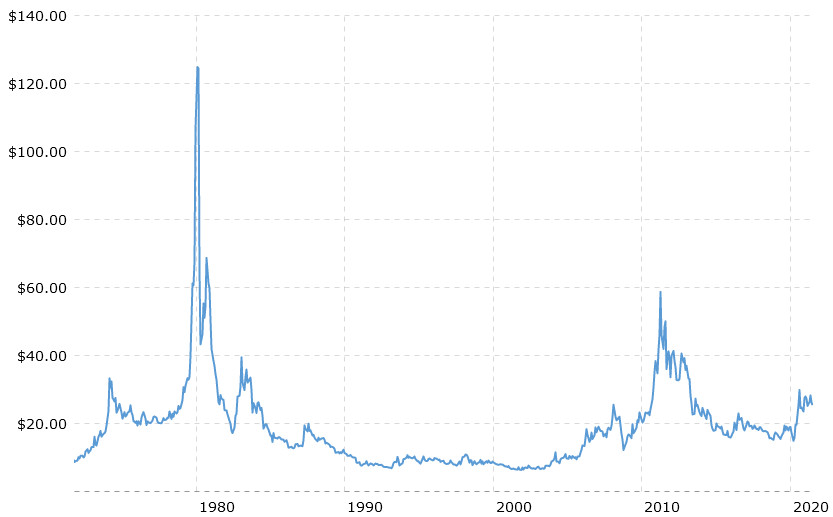
Source: macrotrends.net
As you can see, the $125 peak shown in this chart is nearly 5 times the current price of silver near $25. Even the 2011 $50 peak, adjusted for inflation is $60 today, and that’s still 2.4 times higher than the current silver price.
Actually, the $125 peak shown in the above chart is likely based on an average monthly price, and should probably be closer to $170 to account for the silver’s $50 peak. Using the U.S. Bureau of Labor Statistics’ own CPI Inflation Calculator, $50 in January 1980 is worth $174 today.
While that number might sound high, consider this. Silver generated a return from the 1971 low of $1.31 to its $49, 1980 high of 3,740%. When the bull market started in 2001, silver hit a low of $4.14. If we calculate the same return of 37.4 times, that projects a silver high of $155.
Here is one more chart to help you visualize how much gold, silver and platinum have gained since 1971. This chart shows the gain of $1 worth of each metal since then.
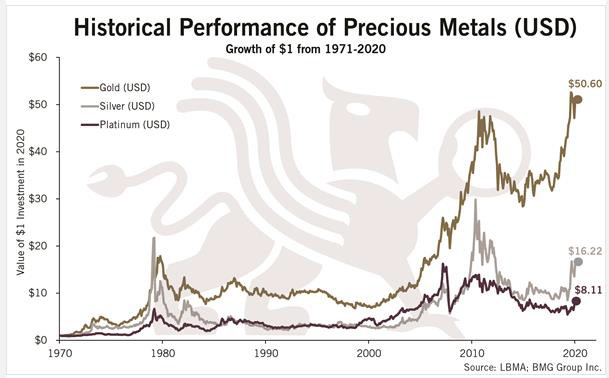
Source: BMG Group
Again we see that gold has managed a much larger advance, in fact more than triple, the gains silver has enjoyed since then. On a relative basis, silver needs to triple just to keep up with gold’s gains of the past 50 years.
Looking at the Silver/S&P 500 Ratio suggests that silver is especially cheap in comparison to the broad stock market. It also suggests that the broader markets may be quite expensive.
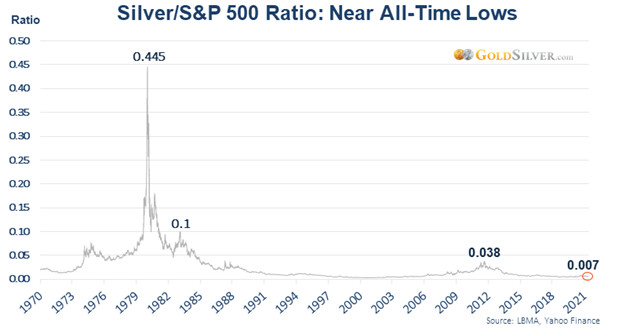
Source: goldsilver.com
Now, if we use the Silver/S&P 500 Ratio of January 1980, and apply it to today, we get an astounding number. At a ratio of 0.445, with the S&P at 4,400, we get a silver price of…$1,958 per ounce !!!! This is even above the current gold price!
I’m not suggesting that silver is going to anywhere near $1,950, but hey, weirder things have happened. Besides, the S&P 500 could drop, and I think likely will. Let’s say the S&P falls by 50% to 2,200. That would still imply a silver price of $975, a long way from today’s $25.
But this next table is probably the most telling. It gives us the prices of several base and precious metals at their 1980 high compared to their levels on February 24, 2021.
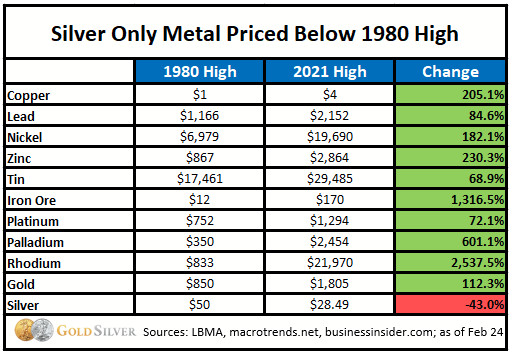
Source: goldsilver.com
It’s simply astounding to see this and realize that most have at least doubled, many have tripled, and some are up 10x and even 20x.
But silver is the clear standout. In fact, it’s the only one that is below its 1980 high — and not just somewhat below. In fact, at today’s price around $25, silver is still 50% below its 1980 peak, without accounting for inflation. That’s senseless.
If you calculate silver’s drop from the $50 peak adjusted for inflation at $174, then silver is currently down by 85%. As part of my ongoing research, I follow a lot of assets. I honestly can’t think of one easily investable sector as cheap as silver is today. And that makes silver and silver stocks very exciting as we look forward.


