
We are in the grip of a veritable stock market mania, at least as lunatic as the tech mania in March 2000 and every bit as nutso as the September 1929 peak, cautions Alan Newman, market timing specialist and editor of CrossCurrents.
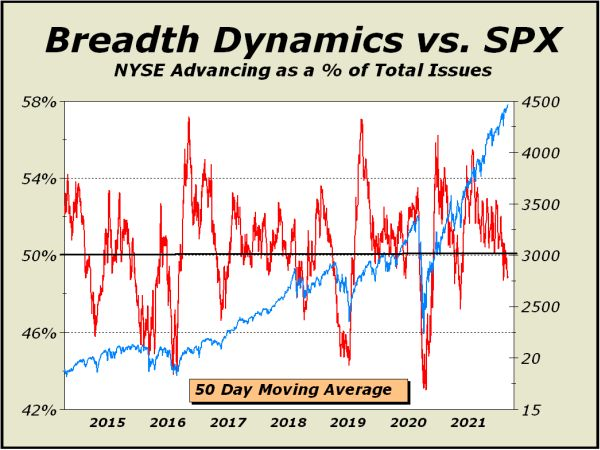
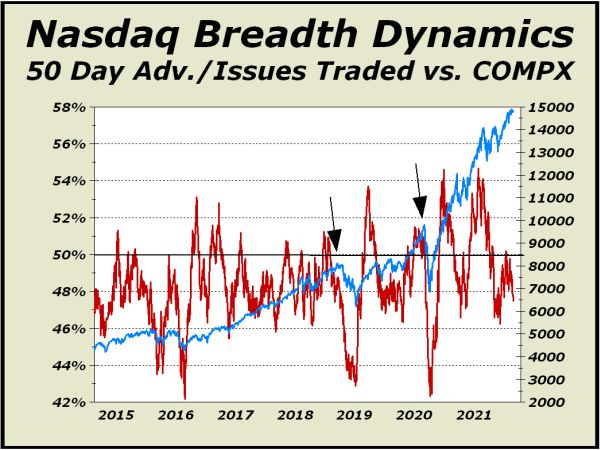
The pictures we offer below are intermediate term in nature. Given a circumstance where the S&P 500 index is in the process of going parabolic, seeing these two breadth indicators in negative territory is appalling.
We see marked similarities to the October 2018 high and the February 2020 high, both immediately followed by swift declines. The similarities include the one sided optimism shown on both occasions cited above. In fact, advisory bulls have been above 50% for the entirety of the last near 15 months. That's a whole lot of bull.
We see several significant signs the long awaited correction may finally be happening. There are changes in character that was not visible in recent weeks. We interpret character changes as the most important factors in our analysis.
Case in point #1:
Sentiment is beginning to shift. Nothing seismic, just sort of a gentle nudge that tells us participants are finally beginning to smell risk. Over the last two weeks (through Friday, Sept. 10th), Investor's Intelligence tally of bears has been 21.3% and 21.1% respectively, the highest two-week percentage of bears since last October.
As well, reduction in total margin debt in August — the first monthly decline in 16 months — likely means risk exposures are being more carefully considered than before.
Leverage has been the key for this bull run for far too long. Enormous exposure to risk can turn to abject fear in a moment, as it did in February 2020 when stocks crashed by a third in only 27 trading sessions.
Case in point #2:
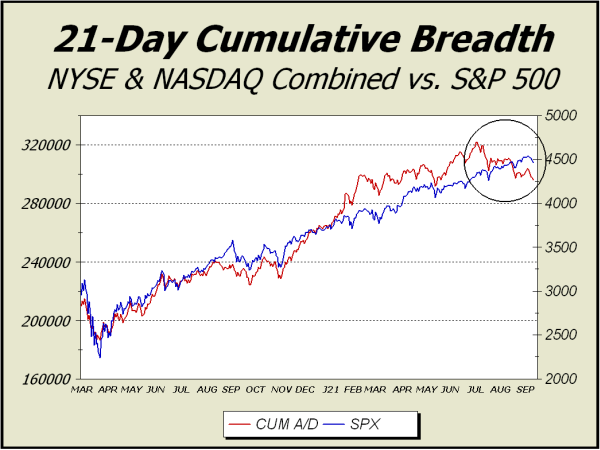
Breadth has turned particularly ugly. From the July 2nd peak for our cumulative breadth measure to the September 2nd peak for the SPX, breadth was negative by 18,175 units. If we include the extra six session until today, breadth is negative 26,213 units. These are bad numbers.
We would now label short term support from Dow 33,271 to Dow 33,741 as "important." Given the change in the market's character, breaks of support levels carry more significance.


