
Inflation is here to stay as economic data continues to show signs inflation could persist for longer as supply chain constraints ease out, asserts Omar Ayales, editor of Gold Charts R Us — and a participant in MoneyShow's Virtual Expo from November 30 to December 2. Register for free here.
The key longer term issue remains the continued increase in prices without a significant increase in labor participation. Until a larger base of people join the workforce, it is unlikely to obtain real growth and stronger demand that could sustain a longer term rise in prices.
The issue doesn’t get easier from here. Supply chains are taking longer than expected to re-establish and the reasons are not easy to fix particularly as local and global commerce remains sensitive to ongoing sanitary restrictions and people’s fear of the virus.
In the U.S., Consumer Price Index (CPI) rose to near record levels. It’s showing inflation is running hot and it’s pushing real yields to their lowest levels since the 80s or 90s. It’s supportive of longer term yields on U.S. treasuries. Moreover, monetary policy remains highly accommodative and global authorities seem to agree that conditions should remain easy until labor participation meaningfully rises to pre-pandemic levels.
The combination of circumstances is likely to continue fueling inflation and lower ‘real rates’ for longer. The recent drop in real yields, given the stronger than anticipated rise in inflation, will likely continue being supportive of gold. And with monetary authorities keeping a lid on rates until labor participation recuperates, real rates are poised to drop further.
Gold is breaking out! It broke above critical intermediate resistance at $1850 showing impressive strength, and a potential cyclical trend reversal. Gold is also confirming support at the August uptrend near $1750.
If gold stays above this uptrend, it could now rise to the August highs near $2100, initially. The next short-term resistance to keep an eye on will be the June highs at $1925.
Gold miners are also on a tear. The HUI Index (gold miner index) broke above the neckline resistance near 265 on a bullish H&S bottom pattern with upside target near $30, the Aug 2020 downtrend.
The leading indicator below is also rising with poise, suggesting momentum remains up for gold miners. This together with strong breakout rises in gold and silver, confirms cyclical and secular strength fueling the gold universe.
Equinox Gold Corp. (EQX) remains on a bullish upward path. It rose to a new high for the move, to the top side of the Aug upchannel, approaching key resistance at the Aug 2020 downtrend near $9.50. The leading indicator is breaking out; this suggests momentum is picking up steam and it could push EQX above its resistance level.
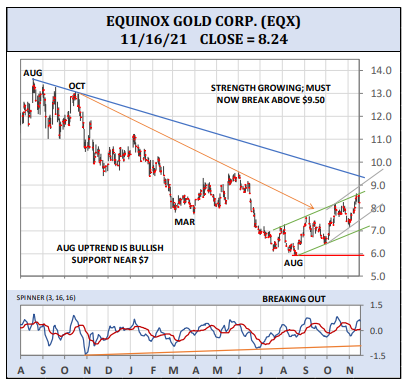
EQX will remain strong above the August uptrend near $7. On the downside, EQX’s key support level is confirmed at $6. Keep your positions as long as EQX holds above this level.
Harmony Gold Mining (HMY) is also looking great! It regained the $4 handle and it’s looking ready for more upside. HMY’s next key resistance is at the August 2020 downtrend near $4.50. A break above this level and it’s off to the races! The leading indicator below is also looking strong, ready to breach a resistance of its own.
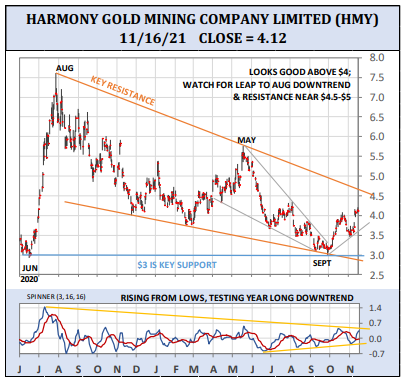
I picked up some more HMY last week just before taking off. The stock is very strong above the September uptrend near $3.75. I’m now overweight and will continue to hold onto our position as long as HMY holds above its deeper support at $3 — the June 2020 lows.
Hecla Mining (HL) rose to the recent Sept ember2021 highs near $6.50. The indicator below is picking up steam with room for more upside. The indicator suggests HL could rise further in the short term.
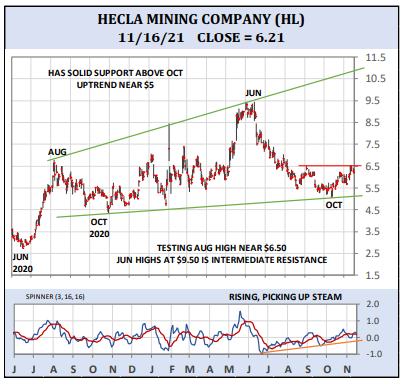
HL must now break above $6.50 on a 2 day close to show renewed strength that could push it to the June highs near $9.50. On the downside, the October uptrend near $5 held during Sept-Oct weakness. Keep your positions as long as HL holds above this level.
Osisko Gold Royalties (OR) confirmed bullish support at the October uptrend near $12.50 by rising to a new high for the move. OR regained the $13 handle and it’s now at the top side of the October up-channel.
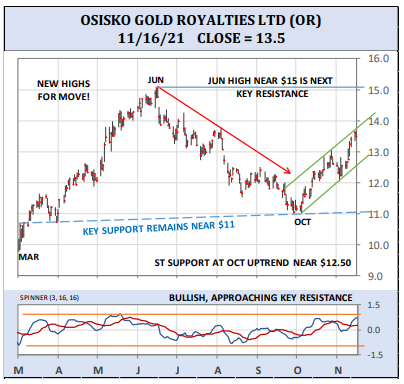
The stock's leading indicator is picking up steam, showing strength, suggesting OR could now rise to the June highs near $15. Keep in mind, OR’s deeper support is at the March uptrend near $11. Keep your positions as long as OR holds above the lower support.


