
February has historically been a rather bland month; since 1950, S&P 500 has averaged a measly 0.001% gain, asserts seasonal timing specialist Jeffrey Hirsch, editor of Stock Trader's Almanac.
Over the more recent 21-year period S&P 500 average performance has declined to a loss of 0.4% in February. Weakness after mid-month is most notable with every index giving back all of their respective early month gains by month’s end.
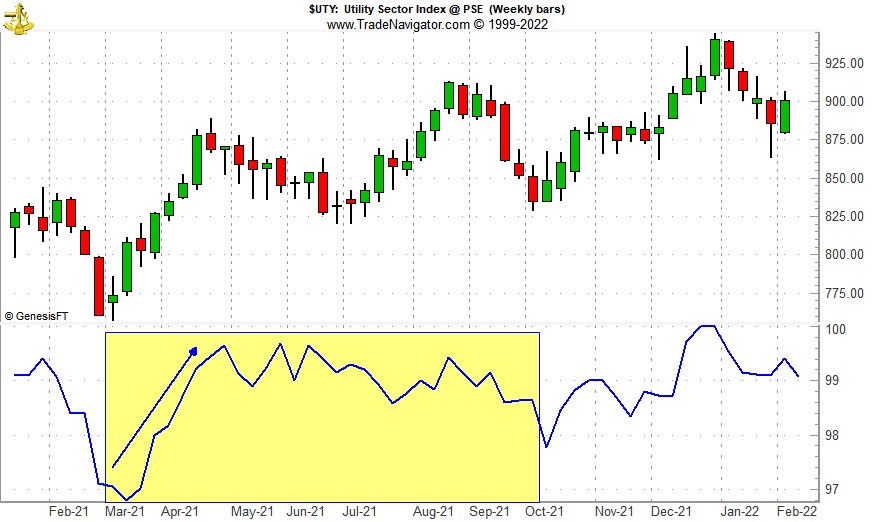
Meanwhile, one sector that begins its seasonally favorable periods in March is Utilities. This year we are going to look to take advantage of any seasonal weakness in February to establish new positions associated with utilities.
In the following weekly bar chart of the Utility Sector Index (UTY), seasonal strength (lower pane, shaded in yellow) typically begins following an early or mid-March bottom and usually lasts through early October although the bulk of the move is typically done sometime in late May or early June (blue arrow).
Last year’s volatile trading has impacted the seasonal pattern in the lower pane of the chart. Typically the pattern is less choppy as the sector does not usually experience major price swings in a year. Utilities tend to be a defensive sector of the market and historically have seen gains during the “Worst Six Months,” May through October.
With over $13 billion in assets and ample average daily trading volume, SPDR Utilities (XLU) is a top choice to consider holding during Utilities’ seasonally favorable period. It has a gross expense ratio of just 0.10% and a relatively attractive yield of 2.93%.
Top five holdings include: NextEra Energy (NEE), Duke Energy (DUK), Southern Co. (SO), Dominion Energy (D) and American Electric Power Company (AEP).
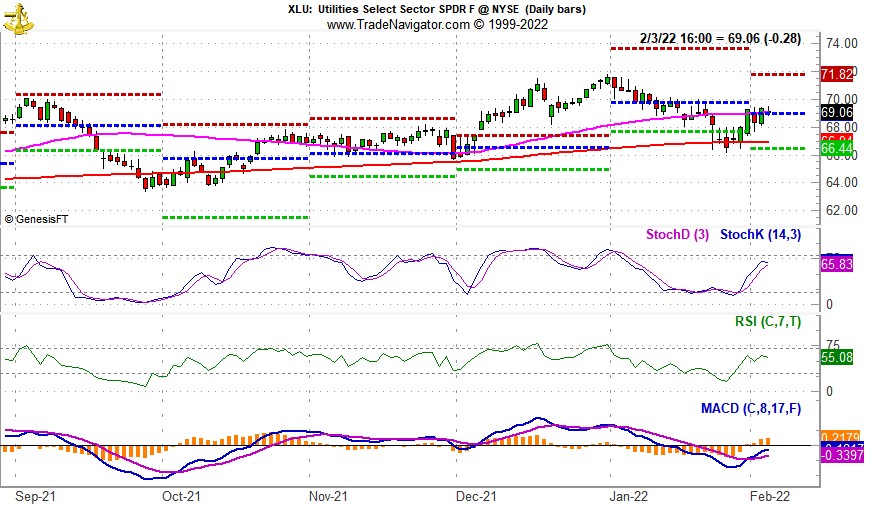
XLU could be considered near current levels up to a buy limit of $69.90. This is right around its projected monthly pivot point (blue-dashed line in daily bar chart above).
After declining for nearly the entire month of January, technical indicators applied to XLU all began to improve in late January and appear to be continuing that trend into February.
Based upon its 15-year average return of 8.3% (excluding dividends and trading fees) during its favorable period mid-March to the beginning of October, set an auto-sell price at $83.27. If purchased, an initial stop loss of $62.91 is suggested.


