Markets will be closed for Good Friday; overall, the shortened week before Easter has been kind to investors, notes Rocky White, senior quantitative analyst at Schaeffer Investment Research.
In this review, I’ll be looking at some interesting statistics around the holiday, including which equities have usually outperformed, and which ones have underperformed in the week before Easter.
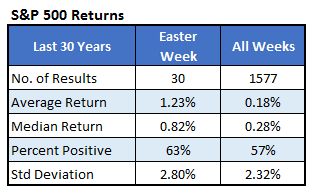
In the past 30 years, the S&P 500 Index (SPX) averaged a 1.23% return the week before Easter, wile the typical weekly return has been about 0.18%. Plus, the percentage of positive returns has been slightly better in the week before Easter, in comparison to all other weeks (63% vs. 57%).
Long Before; Short After
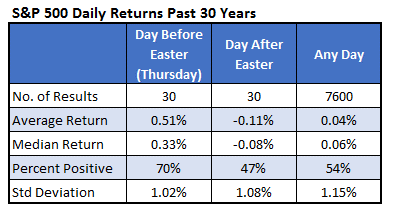
There is a stark difference in how stocks have performed the day before, and the day after Easter. For whatever reason, the day before Easter tends to be bullish, while the day after Easter is typically bearish.
Over the past 30 years, the SPX has averaged a 0.51% pop on the Thursday before Easter, with 70% of these returns positive. Then on Monday, the index has averaged a loss, with only 47% of returns positive. Based on this, it has not been wise to hold short-term positions through Easter weekend.
What's Next?
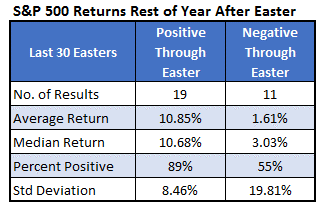
The SPX is down about 4.5% so far this year. It has been a bad sign for stocks when the index was down through Easter Sunday. And while investors may not look at the year-to-date return through Easter as an all-clear signal to buy stocks, the numbers in the tables below are quite clear.
When the SPX was positive through Easter, the rest of the year has been positive 89% of the time, averaging a gain of almost 11%. Years that the index was sporting a year-to-date deficit on Easter Sunday brought positive returns barely half of the time, averaging a 1.6% gain.
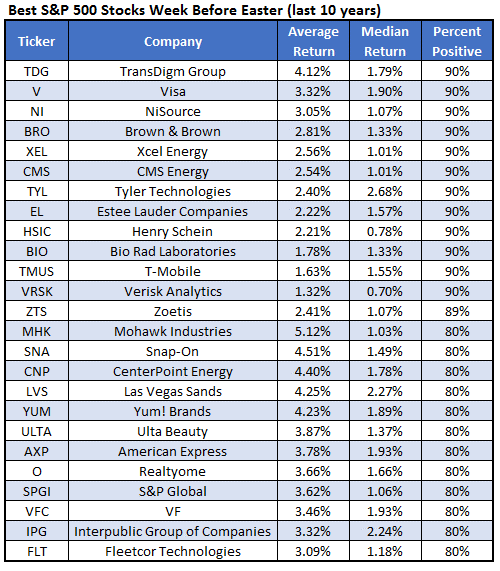
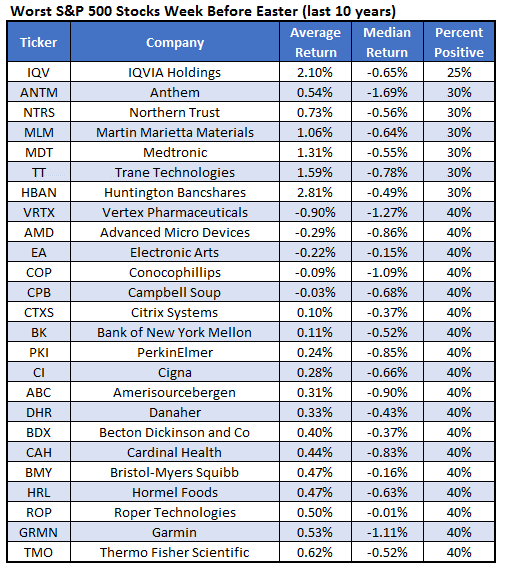
Best Stocks to Buy and Sell Before Easter
Below are two lists of stocks investors may want to target the week before Easter. The first table shows the best SPX stocks during the week of Good Friday, based on percent positive and average return, while the second table shows the worst performers.