
Based on several reliable long-term valuation indicators, stocks are still near levels that coincided with the peaks of both the tech bubble in 2000 and the great stock market crash in 1929, caution Mary Anne and Pamela Aden, editors of The Aden Forecast.
The current bubble was driven to exceedingly high levels, thanks to years of easy money and near 0% interest rates. This bubble is now bursting and we don’t yet know how steep it’ll be.
Much will depend on the Fed and if they keep hiking rates, regardless of the repercussions. But generally speaking, we can make some assumptions based on the past.
Looking at the stock indexes on Chart 3 below you can see the Dow Transportations was the first to break clearly below its June low, dropping into new bear market territory. The Dow Industrials followed to new lows. This is classic bear market behavior.
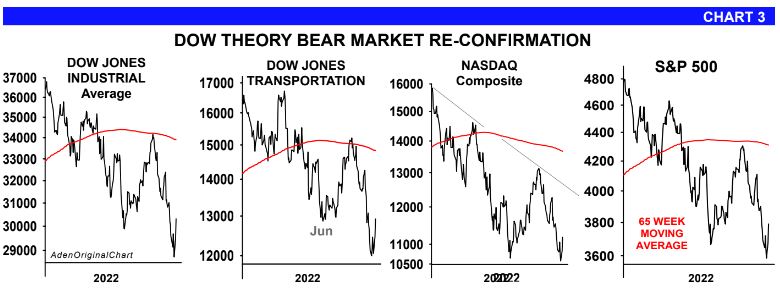
Under Dow Theory, it’s a bearish reconfirmation when rallies fail to penetrate earlier highs, and ensuring declines are carried below their former lows.
This reinforces the Dow Theory bear market confirmation. It also confirms that the primary trend is indeed down and it’ll stay down until it’s exhausted.
In other words, the downward momentum will intensify as the bear picks up steam. And the stock market will become exhausted when it reaches bombed out bargain price levels.
For now, the other stock indexes are also following the way down. And tech stocks are weaker than the Dow Industrials; the Nasdaq has been weaker than the Dow since 2021.
This bear market evolution has happened in every major bear market over the past 100 years (see Chart 4 below, showing the Dow Industrials going back to 1929). That was especially true when the bears also coincided with super bubbles.
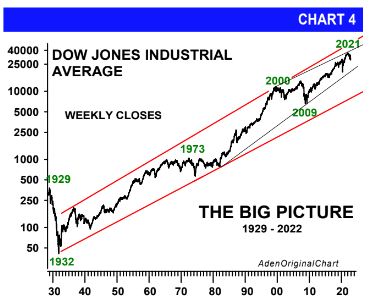
For example, that was the case in 1929, 1973, 2000 and 2008 when the Dow Industrials dropped 86%, 45%, 40% and 53%, respectively, during those bear markets.
Will this one be similar? By all indications, it looks like it could be similar. Basically, the Fed is running the show and as long as they’re determined to beat inflation by raising interest rates, it’s going to be an anchor around the stock market’s neck.
Currently, all of our leading stock indicators are pointing down for both the medium and the long-term (see the S&P 500 and its indicator on Chart 5 below as an example).
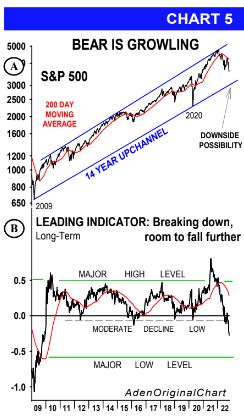
Note, the indicator dropped to a new low once the Fed talk intensified. So even though other things matter, like earnings, the economy, global events and so on, it’s all about the Fed.
In sum, the stock market keeps hitting new lows. The market remains very bearish and expensive, and it’s set to fall further. The Dow Theory has reconfirmed the primary trend is indeed down and it’ll stay down until it’s exhausted. Our advice is the same — continue to stay on the sidelines and out of the general stock market. The tide is against us.


