
The bulls are back in town. November capped off an epic month, with the S&P 500 (SPX) gaining 5.4%, states Lucas Downey of Mapsignals.com.
Even more eye-popping was the rate of buying seen yesterday. Money is surging into ETFs. Investors appear to be feeling better about the markets lately. October and November saw impressive returns of +8% and 5.4% respectively for the S&P 500...solid returns are in line with mid-term election years.
Add to it, Fed chair Jerome Powell’s statement indicating the pace of rate hikes is set to slow, and you have many sidelined investors piling in—especially the retail crowd. Just yesterday, our data saw the most ETFs bought in well over a year. Exchange Traded Funds (ETFs) are a popular way for mom-and-pop investors to get exposure to stocks. Big buying in ETFs has been one of the missing data points all year. But that’s changed in a big way!
Today I’ll walk you through the charts. Then I’ll break down what large fund buying means for investors going forward. Strap in.
Money Is Surging Into ETFs
The flow of money has been one way recently: inflows. You can see that via the Big Money Index chart below. When stocks are getting bought, the BMI surges. Today, the index sits at 71%, the highest level since late August:
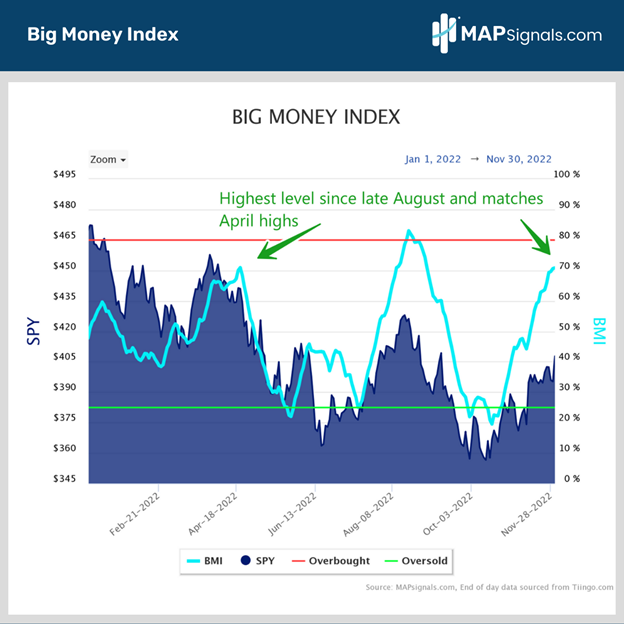
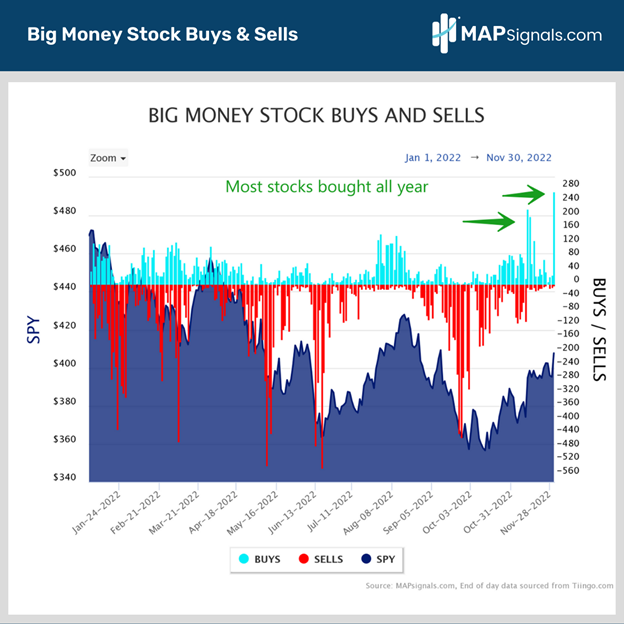
As a reminder, the overbought threshold is 80% (red line above), which isn’t due to hit for some time. But there’s a high likelihood that we’ll hit overbought sometime in December or January. I can say that because stocks and ETFs are seeing epic inflows. To show you what I mean, take a look at the Big Money Stock Buys and Sells chart. This plots the daily counts of stocks marching higher with big volumes. November 30th logged the most buys all year with 272 tickers. This easily eclipsed the large inflows seen on November tenth and 11. I’ve drawn arrows below:
Yep, that’s a surge in buying. However, even more impressive is what happened with ETFs yesterday. Mega buying occurred. And it came out of nowhere. I say that because ETF buying has been absent in our data all year. Finally, that has changed. Retail participation is here, as yesterday saw 101 funds log buy signals. Have a look:
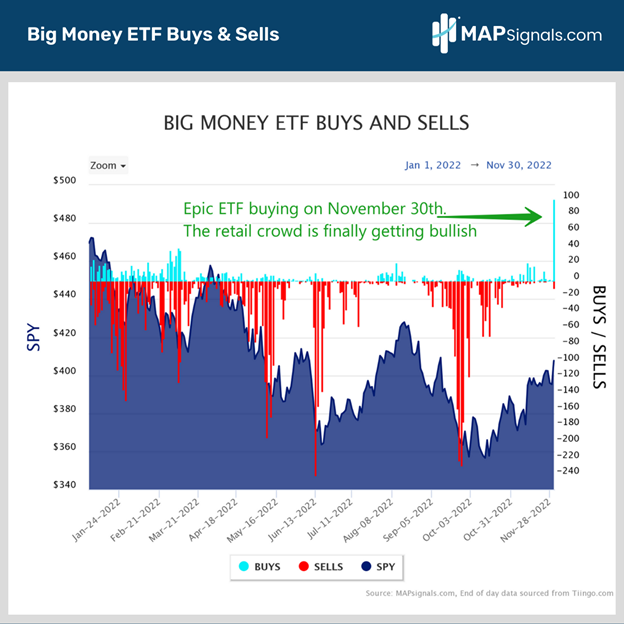
That’s a tall blue bar! Domestic equity funds and international funds were scooped in mass. No doubt, money is surging into ETFs. In fact, yesterday’s surge was the second largest we’ve seen ever, only behind November ninth, 2020, with 104 buy signals. The million-dollar question is: What can investors expect going forward? To answer that, I pulled all prior days with big ETF inflows of 50 or more. Prior to yesterday, there were 32 instances going back to 2010. Overall, the forward returns for the market are positive:
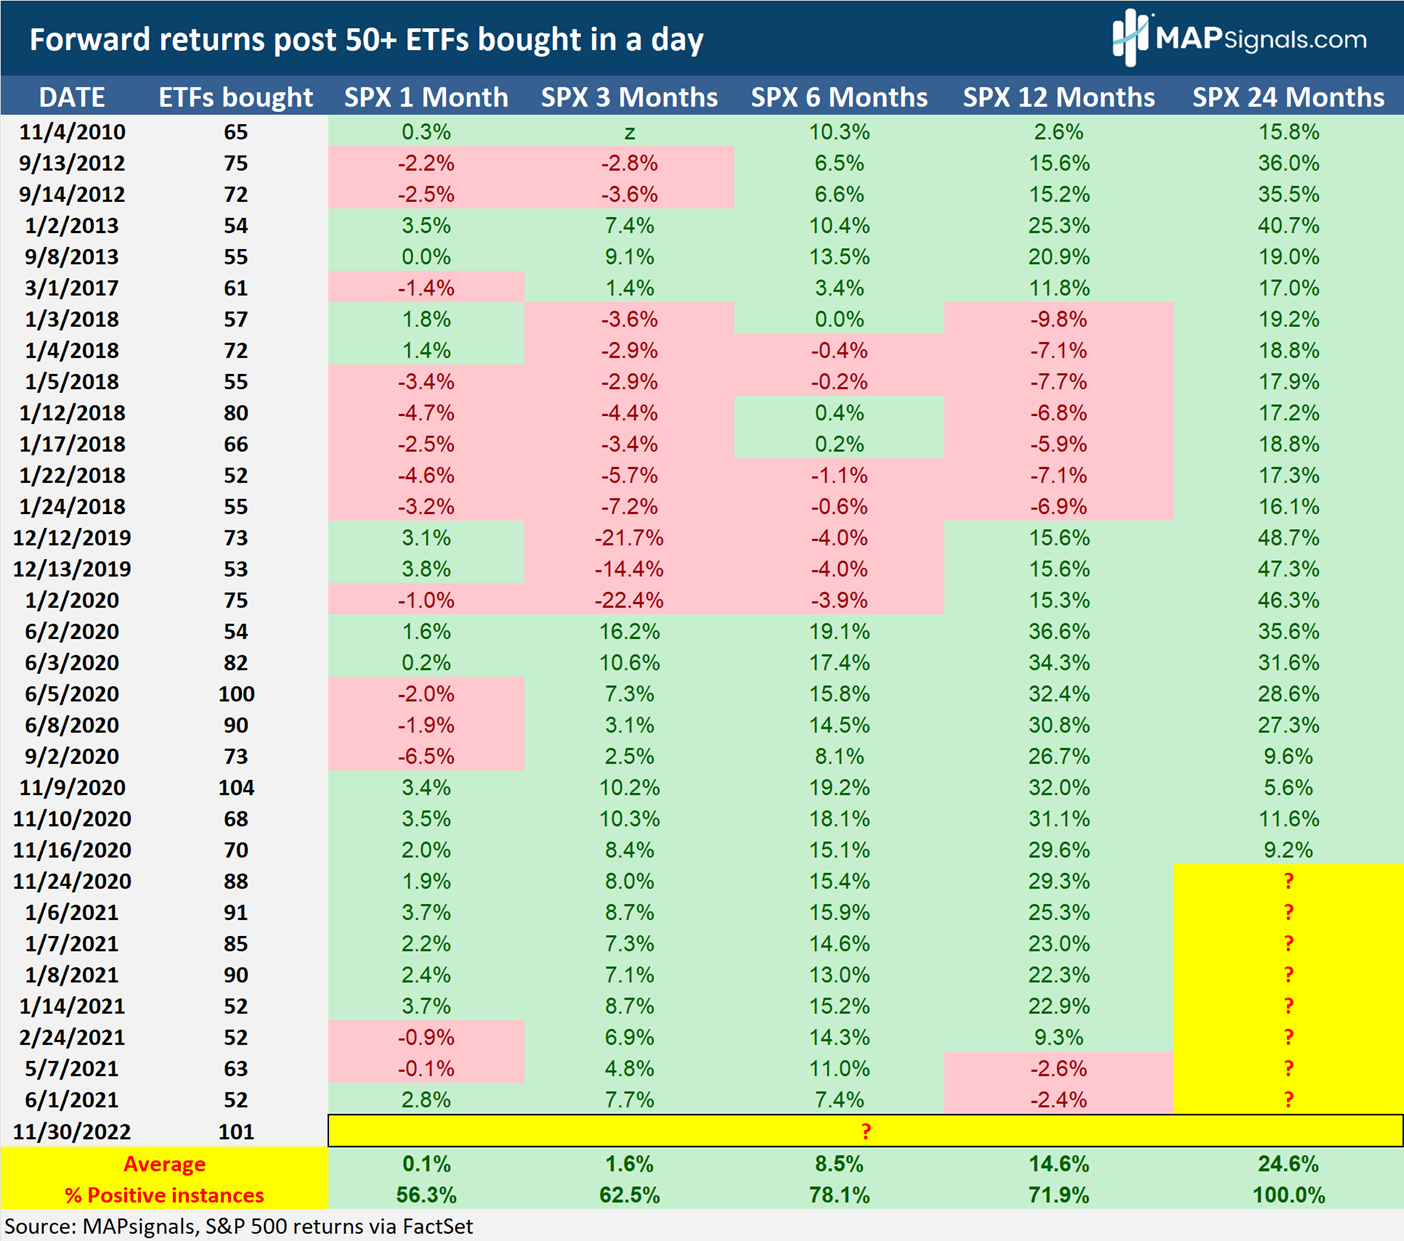
Looking out one-month and three months, returns are ho-hum with +.1% and +1.8% respectively. That indicates there could be some chop ahead. But zoom out and you’ll see the most impressive stats. The S&P 500 is up +14.6% annually after large ETF buys. Two years later it’s up 24.6%. One thing is for sure, buying like this is ultra-rare and won’t last. It’s also not a reason to run for the exits either based on this data. Consider trimming risk once the BMI breaks into overbought territory...likely in a few weeks. Let’s wrap up.
Here’s the Bottom Line
Stocks are under heavy accumulation. Additionally, money is surging into ETFs. Friday saw the most ETF buy signals in well over a year. History says stocks can still run higher. But be on alert once the BMI breaks into overbought territory, likely in December or January. That’s when the market could be set for a breather. Until then, enjoy the bullish run! And remember always to follow the Big Money!
To learn more about Lucas Downey, visit Mapsignals.com.


