
Just to put some perspective of what a $4 trillion market cap looks like when compared to the world economy: It is 3.6% of global GDP. This is in no way an opinion on Nvidia Corp. (NVDA) stock...just a comparison after the incredible run it has had, observes Peter Boockvar, editor of The Boock Report.
For perspective, at its March 2000 market cap peak of about $550, Cisco Systems Inc. (CSCO) was 1.6% of global GDP at the time.
(Editor’s Note: Peter is speaking at our Global Investing Opportunities (and Risks) Virtual Expo, scheduled for July 23-24, 2025. Click HERE to register for a free pass.)
Nvidia Corp. (NVDA)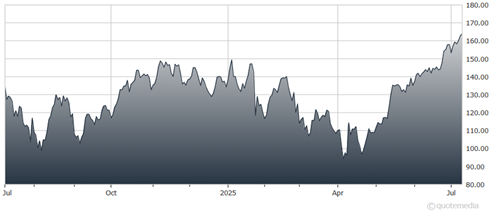
Meanwhile, the Bull/Bear spread in the weekly Investors Intelligence survey widened to 32.6 – with Bulls at 53.8 versus 51 last week and Bears slipping a touch to 21.2 from 21.6. I consider a spread above 30 stretched and one above 40 as extreme.
The more-volatile-and-fickle AAII gauge saw a dip in Bulls of 3.6 points to 41.4 after a 10-point rise last week. Bears were up by 2.5 points to 35.6 after dropping by 7.2 points in the week before.
Finally, the CNN Fear/Greed index closed Wednesday at 75. That was around the highs for this rally.
Bottom line: We have nothing wildly extreme in terms of bullishness. But the skepticism with the rally up until last week is over and the bullish mood is back.


