
"In the spring a young man's fancy lightly turns to thoughts of love"
In the spring, my mind turns to two things: baseball and fishing! I am a born and bred Chicago White Sox fan and I have been an avid fisherman as long as I can remember. Don't get me wrong—love is fine with me, too—but in the spring, I think of baseball and fishing.
When I recently reviewed the portfolio trading I do for myself and my investors, I noticed a pattern: I tend to "fish" (or look aggressively for) large profit or "Home Run" type trades. I can give you a few reasons why they may be easier to find in the spring:
- Grains tend to begin major moves before the beginning of the planting season
- Energy prices, especially gasoline, have a tendency to move higher in early spring
The cyclical nature of grain prices is easily understood. In early spring, the crop the farmers are going to grow is still sitting in seed bags. Traders watch the weather patterns as planting season gets nearer and nearer for clues as to whether the crops will get planted on time and whether they'll get a good or poor start once they are in the ground.
The cyclical nature of gasoline prices is more difficult to understand (or maybe I am just naive). My wife Jeanne always tells me in late January or early February, "Start keeping the gas tank at least half full, because you know they are going to raise rates for spring break and keep them high for Memorial Day." She never tells me to get long crude oil futures, but that subtle hint about gas prices (and she's usually right, by the way) always has me checking the charts to see if I should be getting long crude oil futures.
It always seems that once I start fishing for grain and energy positions, fishing season is open and I generally watch all the commodities and currencies I hand chart for signs of potential portfolio trades. And these aren't my "normal" portfolio trades-meaning trades I plan on keeping for weeks or months. This is spring, and baseball is in the air! In the spring, I find I am eyeing the charts for trade opportunities that will give me home run type profits.
I used to think it was a coincidence that I entered these types of trades more often in the spring. But after reviewing over 20 years of my portfolio trades, I have to admit to myself that I must be looking for these home run types of trades in the spring. Now that I've admitted it to myself, let me show you my current portfolio trades and hopefully you'll be able to see what I am looking for when fishing for these types of trades. All of these trades are marked to the market as of the close of trading Friday afternoon on April 3, 2009. As each part of this article comes out, you'll be able to see whether my stop loss, stop profit, and/or profit orders were useful, prudent, or poorly chosen.
Let's start out with the grain complex, since I always stalk trades in the grains in late winter or early spring:
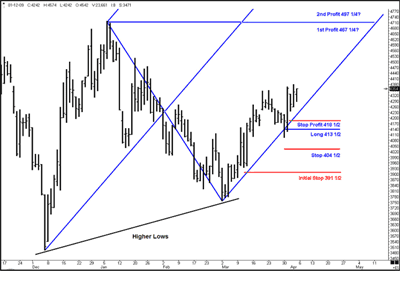
This is a daily bar chart of the December 2009 corn futures on the CBOT. If you are not familiar with the grain markets, speculative traders think of the different delivery months as being either "old crop" or "new crop." Simply put, old crop has been harvested and is in storage, while new crop is either waiting to be planted or is in the fields growing.
Many traders simply take their grain positions in the front month contract, not realizing that there can be an extremely important distinction in price action between old and new crop futures. I think of it this way: If I am speculating that there is going to be a shortage of supply (the Mississippi river freezes, halting grain barge movement for several weeks, for example), I would be taking my position in old crop futures. If I am speculating that weather conditions are going to hamper planting or hinder germination of seeds just planted, I would take a position in new crop futures. The reason behind the price move dictates which will move further, faster. That being said, when I take a spring position in corn futures, I am generally buying or selling the upcoming December corn futures. The December corn futures is the contract where the large speculators load up, long or short, when the grains start to move (unless there is a supply situation, which would cause them to buy or sell the nearest old crop futures).
Prior to 2003, the "normal" trading range for corn futures was just over 200 to just over 300. The averaged hedging price at grain elevators during that period was $2.26 a bushel, which is the price on which a farmer would base his crop production and profitability. But grain prices, like oil and metal prices, exploded over the past three to five years and they reached an incredible climax last summer. After trading well over 700 in July of 2008, corn traded back down to 350 by early December 2008!
Looking at the December corn futures chart above, you can see that after corn reached its December lows, it began to climb higher, making it to 475 in early January before heading lower. There was an orderly decline in prices that ended just below 375 in early March. Then corn futures began to make higher highs and higher lows, signaling a change in behavior. When prices broke above a prior swing high at 411, I added a blue, up-sloping Median Line set to show me the probable path of price.
There are two key elements on this chart (besides it being spring) that make me interested in fishing for a long corn futures position:
- The March 2009 swing low is higher than the prior major swing low in early December 2008
- Price broke above the prior swing high at 411 and began making higher highs and higher lows
Both lead me to believe a change in behavior has taken place in the corn futures market, and so I begin looking for a high probability trade entry set up.
From my past experience, I know that the grain markets often pull back, but when the pullback reaches its top or bottom, it is often a 'V' formation-meaning prices reach their highs or lows on one bar and then close a good distance away in the opposite direction. And price seldom comes back to re-test this new high or low. That means I am generally unable to use my favorite set up, a test and re-test of an up- or down-sloping line, to enter these portfolio positions. Once I have determined what I believe to be the probable path of price, I identify an area for an entry and begin working a limit buy or sell order in that area. If I am trying to enter against a sloping line, that means I have to move the order at the end of each day to match the slope of the line.
In this case, I begin working orders to buy December corn futures where price will intersect with the blue, up-sloping lower Median Line parallel. On Monday, March 30, my limit buy order gets filled at 413 1/2. My initial stop loss order on this position is below the last prior swing low, at 391 1/2. My first profit target is just below the highs made earlier this year, at 467 1/4. My second profit target is just below an area of congestion, at 497 1/4.
Corn prices spiked higher on Tuesday, closing above 435. After the close, I cancelled my initial stop loss order and moved it higher to 404 1/2, five cents below the low made on Monday. On Thursday, corn prices made a new high for the move and corn closed on its highs Friday, April 4, at 435 1/2. After the market closed on Friday, I cancelled my stop loss order and entered a stop profit order at 418 1/2. My intuition tells me this order is a bit close to the current price action and I might get washed and rinsed out of this position, but I don't see a quality area to hide a stop profit order. If prices plunge lower from this current leg up, I prefer to lock in some profits and come back to fish another day.
Tomorrow, we will take a look at the soybean market!
More tomorrow in Part 2.
Timothy Morge
timmorge@gmail.com
www.marketgeometry.com
www.medianline.com


