
Like the grain markets, crude oil futures had an amazing rally that ended with an equally amazing vertical selloff that began in July of 2008. Depending on the contract month you were watching, crude oil futures made it up to just about $148 a barrel. By the middle of January, crude oil futures broke below $33.50!
Most traders no longer trade off of the weekly or monthly charts. Markets move fast and traders are generally drawn to smaller timeframes. I still hand draw daily, weekly, and monthly charts for 27 different commodities and currencies, and honestly, I find that some of my best "catches" when fishing for large moves come off of my hand-drawn charts. There is something about the time spent drawing in a daily bar, then waiting for another day's trading to end before adding to the chart. I can't tell you exactly what it is, but that pause between adding each bar and then the actual physical drawing of the bar, with its open, high, low and close, gives me a feel for that market that I cannot duplicate when watching a computer-generated chart paint daily bars on a screen. The weekly and monthly charts also have their own unique rhythm. The act of adding that next bar after spending an entire week or month pondering the formation building in front of you on the hand-drawn charts has some mystical quality that gives me a much better feel for what has already happened, what is happening currently, and what may happen next.
On my monthly charts of crude oil futures, the rally above $35 a barrel and the subsequent fall back below it take up a very small portion of the chart, perhaps 5% of the entire chart, while 95% of the chart is filled with price action above $10 a barrel and below $35 a barrel.
Picture in your mind drawing in a long bar as price spikes above $40 a barrel, followed by another long bar that ends higher as price runs above $60 a barrel, and then $80 a barrel. There's a pause of three or four bars as price consolidates and drops back to test $50 a barrel. Then you are drawing in wider bars again, each making new highs for the move as crude oil tops $100 a barrel, $120 a barrel, and then finally hits $143 a barrel!
You sit down to draw in the bar at the end of the next month. It opens at $140 a barrel, and like the prior bars, it continues higher, finally getting to $148 a barrel. But then your pencil does something it hasn't done the entire run up: It heads lower, down past $140 a barrel, past $130 a barrel, all the way to $120 a barrel! This bar is nearly $30 from top to bottom, an amazingly long monthly bar—and it closes on its lows.
But this won't be the last long bar that closes much lower that you draw. The next five monthly bars are all very long and they all close near their lows. You draw six bars that erase the entire move up from $35 a barrel to $148, and suddenly, price is right back where it started!
Each bar I added headed back towards the long-term "normal" range of $10 to $35 a barrel and one thought kept going through my mind: "What was resistance is now support." If crude oil prices showed any sign of congesting and then gave me any clues of a potential change in behavior, I'd have to be fishing in the $30 to $35 area. My words probably don't do justice to the story of the monthly crude oil chart, so let me show you the actual monthly chart of crude oil futures. As you look at the following chart, imagine drawing the long bars up and then drawing the long bars down. And look at the 240 or more bars to the left that all fall between $10 and $35 a barrel!
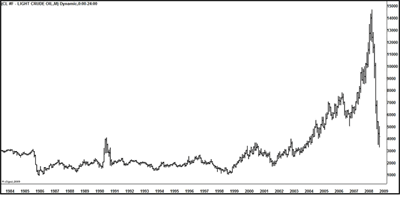
Now that I've shown you the "big picture" that I kept seeing at the end of every month as I updated each bar on my paper charts, you should be able to see that price may be at an area where it may start to congest or show signs of a change in behavior. But remember: Just because it may be in an area where it may shows signs of a behavioral change, it still may simply continue to head lower. The market is always right, and it goes where it wants to go!
Before I can fish, I have to see some encouraging signs from the market. Tomorrow, let's move on to the weekly crude oil futures and see if we see any signs that price is congesting, or better, if we see any signs of changes of behavior.
More tomorrow in Part 4.
Timothy Morgetimmorge@gmail.com
www.marketgeometry.com
www.medianline.com


