
What Is a Butterfly Pattern?
- Contains an ABCD pattern preceded by a swing high or low (XA)
- Reflects convergence of Fibonacci extension ratios
- Point D at extensions of BC and XA
Formed by two connecting, symmetrical triangles
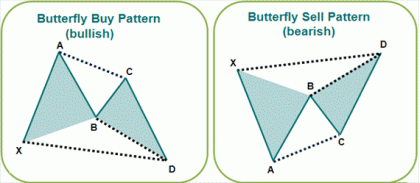
Click to Enlarge
Why Is the Butterfly Pattern Important?
- Convergence of Fibonacci extension ratios increase probability of future support/resistance, thus increasing odds of temporary market reversal
- Typically provides more favorable risk/reward ratios
- Pattern is found at significant tops and bottoms
- Pattern failure may indicate strong continuation move
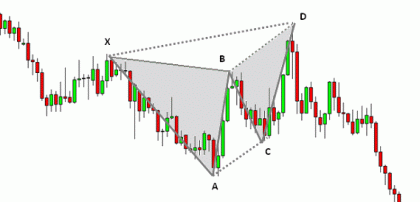
Click to Enlarge
How Do I Find a Butterfly Pattern?
Butterfly patterns are similar to Gartley patterns in that they resemble a skewed “W” or "M" shape on a price chart. However, a butterfly pattern completes at the convergence of two separate Fibonacci extension levels whereas the Gartley completes at the convergence of a Fibonacci retracement and extension.
The beauty of the butterfly lies in its symmetry between the two connecting triangles at point B. As with all geometric patterns, a buy or sell signal occurs as the pattern completes at point D.
Bullish Butterfly Pattern Rules (Buy at Point D)
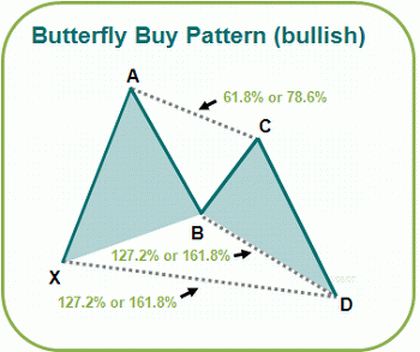
Click to Enlarge
1. Swing down from A to D is 127.2% or 161.8% extension of XA
a. D must be below X
2. Valid ABCD must be observed in extension move (AD)
3. Additional confirmation attained when time and price are in proportion
a. Time of XAB and BCD triangles ideally "equal," but BCD may fall within 61.8%-161.8%
4. Move beyond 161.8% negates the pattern
a. May indicate strong continuation move in progress
Bearish Butterfly Pattern Rules (Sell at Point D)
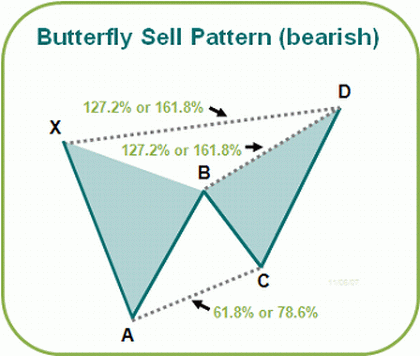
Click to Enlarge
1. Swing up from A to D is 127.2% or 161.8% extension of XA
a. D must be above X
2. Valid ABCD must be observed in extension move (AD)
3. Additional confirmation attained when time and price are in proportion
a. Time of XAB and BCD triangles ideally "equal," but BCD may fall within 61.8%-161.8%
4. Move beyond 161.8% negates the pattern
a. May indicate strong continuation move
By Roger A. Stojsic of GFTForex.com


