A simple line can be the start of everything. In this presentation, I am going to begin a series of discussions about Action Reaction Lines and Diamonds®, a proprietary charting method I developed well over 20 years ago. Both have served me well in my own trading and this is one of the first times I have given any information publicly regarding the correct rules for using either technique. Both are simple, yet powerful if you use solid money management.
Let us begin this journey with a look towards physics.
Sir Isaac Newton is thought of as a physicist, a mathematician, and the founder of calculus. But he was also the “Master of the Mint” later in his life and literally saved England's financial system by switching from the silver standard to the gold standard. Even less well known, Newton was a master alchemist, so heavily involved in alchemy that he eventually died from having massive amounts of mercury in his body from his many alchemical experiments.
But Sir Isaac Newton's contributions to science should not be diminished. He developed the first practical reflecting telescope and his Three Laws of Motion dominated the scientific world until the early 20th century. His Third Law of Motion—“For every action there is an equal and opposite reaction”—is particularly useful when applied to the trading markets. The Third Law of Motion may have had its founding in Newton's first and true love, alchemy, for he was truly one of the most important alchemists in his lifetime. His favorite alchemical manuscript was the emerald tablet.
Hermes Thrice Greatest, or Thoth, was reported to have lived around 1900 BC. The Emerald tablet is attributed to Hermes, and Sir Isaac Newton's translation is perhaps the most popular alchemical work still studied today. Its essence is simple: “As above, so below.”
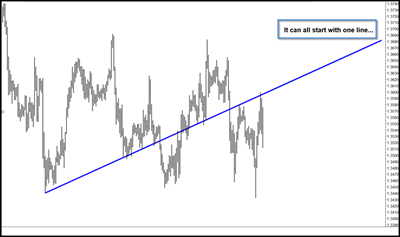
Let's take a look at the chart. It can all start with one line:
We are looking at a chart of the euro FX futures on the Chicago Mercantile Exchange. The 60-minute bars on this chart appear in early March of 2010. I begin with a major low pivot on the left of the chart and draw a blue, up-sloping simple trend line that touches many smaller pivots. I call this simple trend line with many touches a multi-pivot line.
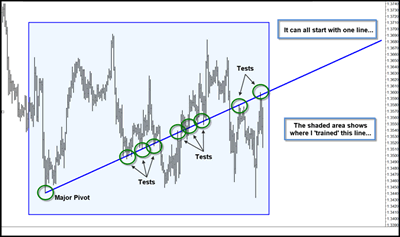
Let's look at another chart and I'll show you the pivots I chose to draw this line.
|pagebreak|When working with charts and hand drawing lines in particular, it's important that you remember and mark where you trained or curve fit the particular line you are going to work with. Here you can see that I used many pivots, and the up- sloping blue simple trend line does a good job catching the highs and lows of price as it moves forward. Remember every bar within the blue box was used to train or draw the simple blue trend line.
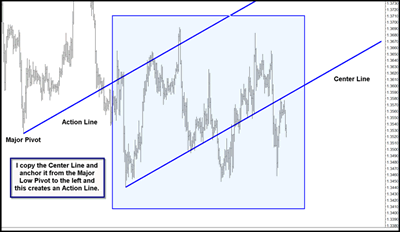
What can I do with this simple blue trend line? Another name for this simple trend line that goes through so many pivots is a center line.
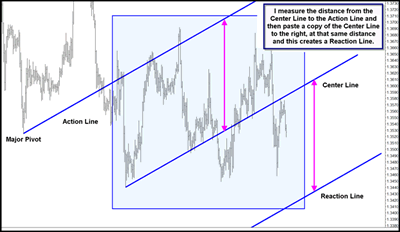
I look to the left and see a major swing low. Starting at the major swing low to the left, I copy the center line and project it forward. The original simple trend line is called the center line and the second line is called the action line. It carries the same slope or frequency as the center line. Note that the center line captures the frequency of price and the pivot of the action line always precedes or comes before the pivot that begins the center line.
Now I think back on the emerald tablet: “As above, so below.”
I have generated a center line that catches the frequency or probable path of price and copied the center line to a prior major pivot to generate an action line.
“As above, so below.”
I wish you good trading!
By Timothy Morge
email me: timothymorge@marketgeometry.com
www.marketgeometry.com


