“The Williams %R on the SPY is -6.58; we need a pullback.”
“The Slow Stochastic or %K is 93; definitely overbought.”
“The RSI is nearing 70; get ready to unload.”
I have seen a lot of statements like these lately, touting that the market is overbought and needs to pull back or rest, but is it? To answer that question, one needs to know their trading horizon and then understand how to cut through the noise of the indicators.
Trading Horizon
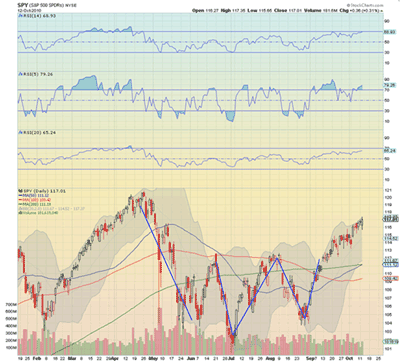
Whether or not the market is technically overbought can depend on your trading horizon. Keeping it simple, a textbook definition would state that an RSI over 70 is overbought and an RSI under 30 is oversold. Look at the chart in the middle of the page and focus on the three sets of RSI indicators at the top of the chart. This is the same indicator calculated over three different time periods. The top set uses the price change over a 14-day period and is the “standard” in most chart packages. The middle set uses a five-day period, and the bottom a 20-day period. The first thing to note is that they all have the same general shape, but the shorter the period, the more overbought and oversold signals that are generated. This makes sense. The market fluctuates daily, and if your calculation is skewed to short-term changes, you will get more signals.
If you are a swing or daytrader, then you should be more concerned about the very short term and using a five-day (or even shorter) time period in your RSI is appropriate. If you look at the market weekly and want to be more certain that a longer-term trend is going to change, then increasing to a 20-day time period is more appropriate. The second thing to note is that in the current market for the SPY, the five-day RSI is overbought at 79.20. This and other oscillators on a short-term basis are leading to some of these overbought calls. But the 14-day is just approaching 70, and for the longer-term investor, still has some room higher. So which is right? They both are. The daytrader needs to be nimble, but the longer-term investor wants to make sure that the trend is changing before trading. Customize your indicators to your horizon.
So the market may or may not be overbought, but does it matter if you are trading on a short time frame? Another important point is to make sure that you do not blindly follow an indicator without understanding it, understanding what it is telling you, and knowing why you are using it. As an example, looking at the 14-day RSI, which is used by many traders, if you decided to sell when the RSI became overbought in March of this year, you would have missed the run from 110 to 120 in the SPY, a 10% move.
A market can remain overbought or oversold for a long time. Steep sustained moves can get overbought quickly. Is a fast-rising market bad? Not all the time. Momentum oscillators can be very useful and add a lot to the story, but remember that they are called indicators. Price is king, and the indicators should be used as warning signs. As an analogy, every time you see a “Deer Crossing” sign while driving, a deer does not run onto the road. You don’t stop; you keep driving the car. But knowing that a deer could dart in front of you puts you on alert. Use your indicators to raise your awareness, not to stop you from the mission.
By Greg Harmon of DragonflyCap.com


