By Andrew Hart of ETFTradr.com
We all know the ride’s going to end sometime, but in the meantime (and until further notice), it’s still a trade-worthy ride. What is it? It’s this bullishness. Yes, it’s overextended, hard to believe, against the odds, and…not a bit surprising to us?
One of the greatest parts about being disciplined enough to stick to a proven trading methodology is that you really don’t have the option—in a good way—of convincing yourself it’s “Alright to ignore the evidence just this once.” Either something is bullish or it isn’t. One of Price’s oldest and most successful bull/bear methodologies can be applied by the marking of just two ETFs. Which ones? The S&P 500 Depositary Receipts (SPY) and the Powershares QQQ (QQQQ). Here’s the gist:
You’re probably aware that the market’s different indices—and different ETFs—tend to move in tandem with the market’s bigger trend. What’s not quite as recognized, however, is that the Nasdaq tends to lead the way with stronger moves, both up and down.
The practical application of such a theme is two-fold. First, spotting this relative strength of the QQQQs over the SPDRs (or QQQQs under the SPDRs, in bearish cases) can identify new trends as they emerge. Second, and perhaps better, by waiting for the Nasdaq’s relative leadership, you can distinguish the real emerging trends from the fakeouts.
A couple of examples will really nail down the premise.
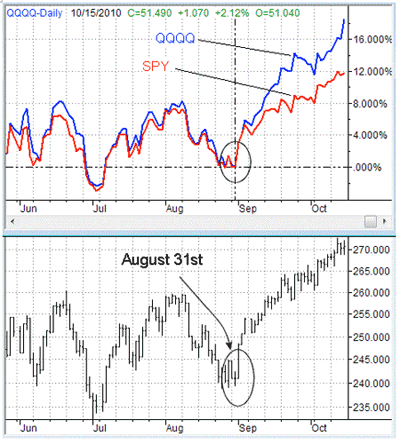
On the chart below, we’ve plotted the percentage change of QQQQ versus the percentage change of SPY since August 31, when the market made a sharp and unexpected reversal. At the bottom is the S&P 1500—most of the market. See the clear and widening divergence between the SPDRs and the QQQQs? It was the biggest disparity we’d seen in months, and at the same time, we saw the biggest and most prolonged gain for the market that we’d seen in months.
NEXT: Bullish and Bearish Examples of This Pair in Action
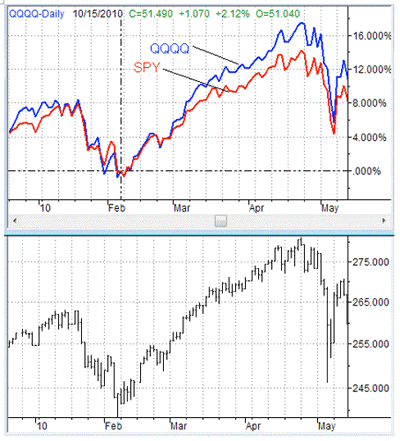
|pagebreak|Here’s another example. The big rally from February 5 through April 23. That 15% gain was marked by a clear bullish divergence between QQQQ and SPY starting on March 1 (really before then).
QQQQ Relative Strength over SPY
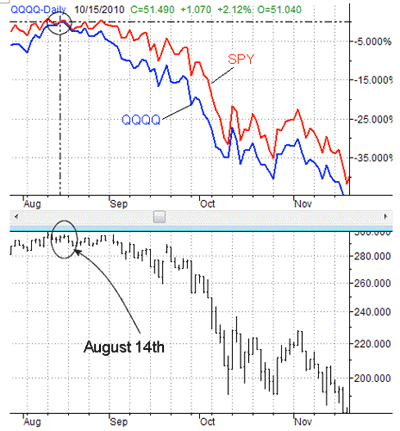
How about a bearish example (yes, it works that way too)? Remember the market’s implosion from late-September 2008? We actually got an early warning in early September 2008. Several days before the market even started to tumble lower in a big way, the QQQQs started to slide lower at a notably faster pace than the Spyders did.
SPY Relative Strength over QQQQ
You get the idea. Though not every single one of the market’s major turns are marked this distinctly, the vast majority of them are.
In any case, this is just one of the many ways to use ETFs in ways beyond just owning them (though we offer that ETF-picking service as well).
By Andrew Hart of ETFTradr.com


