By Kyle McEwan of Lind-Waldock
The futures markets involve the use of leverage, which can cause large losses in a short period of time. Futures contracts have expiration dates, so timing is also very important when trading. Many market participants use technical analysis to help alleviate potential risk and determine appropriate entry and exit points on trades.
Technical analysis involves analyzing historical market activity and investor behavior in order to predict probable futures price trends. It is based on three assumptions:
- All influences on market action are automatically accounted for or discounted in the price,
- Prices move in trends and trends tend to persist over time, and
- Future trends can be found by looking back at history
Technical analysis is essentially an indirect study of the fundamentals. It assumes that no further fundamental information is already priced into the market. Pure market technicians believe fundamental analysis, therefore, is not a worthwhile exercise. Technical analysis does involve supply and demand, but it analyzes the effects— rather than the causes—such as price, volume, sentiment, and open interest over time.
For What Do We Use Technical Analysis?
Traders use technical analysis to improve market timing, to help forecast price movements, and to act as a leading indicator. Forecasting price movements helps determine trends and trend turning points. Leading indicators point to changes in market trends before the fundamentals reflect the change. If you can uncover a potentially bullish or bearish formation as it develops, you can plan an appropriate trading strategy based on the idea the pattern will be completed. Of course, this analysis is often subjective, and different analysts may interpret charts in different ways.
Types of Charts
Charts provide a visual picture of price history. They can also act as a leading indicator by providing a warning signal of possible supply and demand shifts taking place. They can also help identify repetitive price patterns and measured moves of those patterns.
Bar Chart
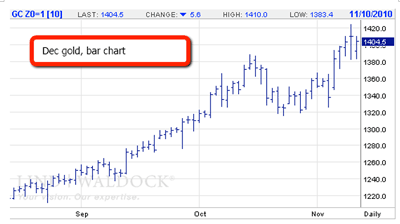
The bar chart is the most commonly used type of chart. It contains four price components: The open, high, low, and close. The high is the top of the bar, and the low is the bottom of the bar. The open is measured by a horizontal bar to the left, while the close is measured by a horizontal bar to the right. An example of a bar chart follows.
NEXT: Master the Basics of Candle and Line Charts
|pagebreak|Candlestick Chart
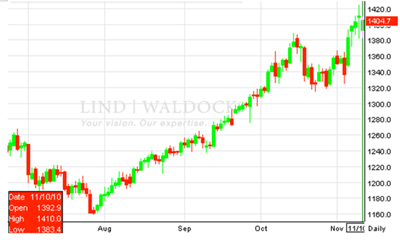
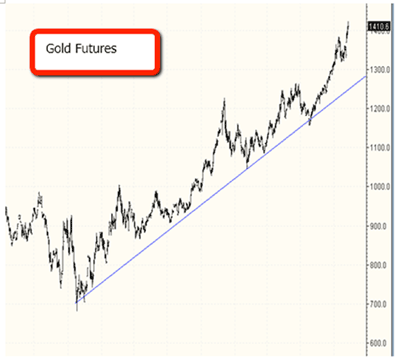
The candlestick chart is one of the oldest types of charts, dating back to rice trading in the1700’s in Japan. It presents a visual picture of the relationship between price points and their relative strength or weakness, and has four price components: The open, high, low, and close. Candlestick charts provide patterns that are easily recognizable through candle formations (typically red and green). The names given to these formations are equally as colorful—such as the “harami cross” or the “evening doji star.” Below you can see a chart of gold represented with candlesticks.
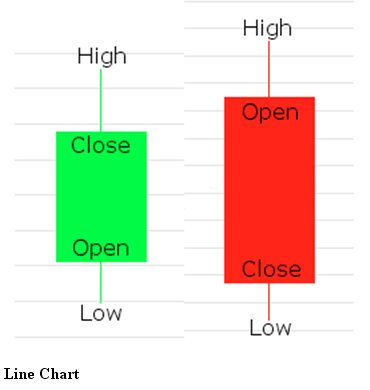
So what do these candles represent? A green candle indicates bullish price action with a close higher during the established time frame. A red candle represents bearish price action with a close lower during the established time frame. One candle can represent months, weeks, days, hours, or minutes of trading. They provide an indication of market momentum and help identify and interpret support and resistance (which I will cover later). There are many interpretations of the various candlestick patterns, which you can explore in more depth if you are interested in learning more. These charts are very useful in easily identifying price patterns.
Line Chart
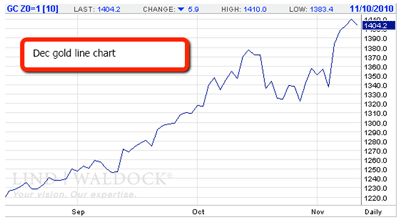
In a line chart, only the closing prices are graphed; you can’t see the open, which may be important information to have. However, it provides a clearer picture for long-term trends.
NEXT: Point-and-Figure Charting; How to Spot Key Trends
|pagebreak|Point-and-Figure Charts
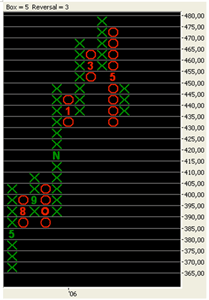
This type of chart tracks only price changes with no time element. The market has to move a specified amount before it is reflected in the price. For example, you might specify gold has to move $1 before the chart reflects that change. An “X” on the chart reflects an increase in price, and an “O” reflects a decrease in price.
Point-and-figure charts provide discovery of price trends and intraday support and resistance. While these charts have limitations, they are flexible and can be designed to be more or less sensitive to price changes.
Trend Analysis
One of the most important things technical analysts strive to do is determine the trend, and one of the rules of technical analysis is that we need at least three points to verify a trend. You can see the clear uptrend in the chart of gold. Until you see the lower line broken, it is presumed the trend remains intact. Remember, the trend is your friend! If you find a trend, trade with it.
NEXT: The Core of Technical Analysis: Support and Resistance Levels
|pagebreak|Support and Resistance
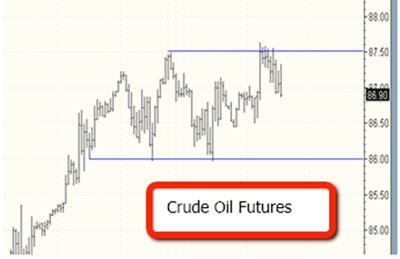
Support and resistance measures the forces of supply and demand at work in the market without it even being necessary to know the fundamental factors involved. A market hits resistance when prices rise too high to attract buyers, and it hits support when prices have fallen far enough to attract buyers. In the following chart of crude oil futures, you can see a clear low holding as support near $85.96 per barrel. That’s a perceived value level where there are enough willing buyers to keep the price from sinking further. When you see channels of support and resistance (like those indicated on the chart), you can find favorable levels to enter and exit trades.
Continuation (Consolidation) Patterns
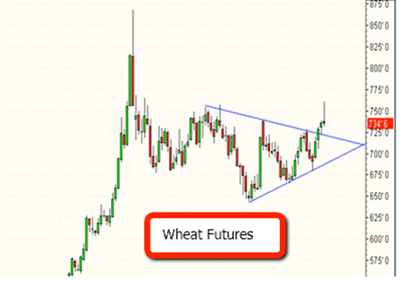
Certain chart patterns can help us not only determine the overall trend, but also whether the market is consolidating for a period of time within a trend. You can see a common continuation pattern—a wedge formation—on the next chart of wheat. There are several other types of consolidation patterns you may have heard of, including triangle patterns and flags.
These patterns don’t pinpoint areas to enter specific trades; you wouldn’t want to put on a directional bet until you see a breakout from a continuation pattern. When you see this type of pattern, it helps you recognize that the market may be setting up for a breakout. Most technicians would use another technical indicator to help you determine which way the market might break out of this pattern, such as the Moving Average Convergence/Divergence (MACD) indicator. A cross in the MACD lines offers a signal to verify which way a breakout might be headed.
What are moving averages, and what is the MACD? We’ll discuss that next.
|pagebreak|Moving Averages
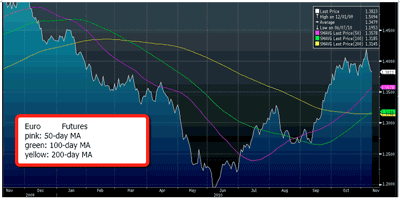
Moving averages represent average price action over a specified time period. They are a great tool to determine momentum as well as support and resistance. You can use virtually any time period to calculate moving averages, but 50-day, 100-day, and 200-day moving averages are the most commonly used longer-term averages. You might use the 9-, 12-, or 18-day moving averages for short-term trading.
In the next chart of the euro, we can see these moving averages represented by the colored lines. When moving averages cross over each other, it can provide buy and/or sell signals for traders.
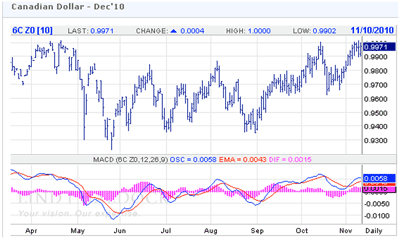
The Moving Average Convergence/Divergence, known as “MACD” shows the relationship between moving averages. The MACD can help identify buy and sell signals, which you can see at the bottom of the next chart of the Canadian dollar. When a moving average crosses the MACD line from below, it offers a bullish signal, and a cross from above offers a bearish signal.
Volume
Volume is also an important measure to watch. When you see a breakout, you’d like to see it accompanied by healthy volume. If a move isn’t backed by substantial volume, that’s a warning sign. So volume is a good validation tool used in conjunction with other indicators.
Commitments of Traders Report
The Commitments of Traders (COT) report is not related to charting, but it is a popular and useful tool for traders. It is published every Friday by the Commodity Futures Trading Commission (CFTC) and provides data on positioning among various market participants in the futures markets. It offers a breakdown of outstanding market positions (represented by open interest) among investors and traders in various categories, including commercial hedgers, large funds, and speculators.
Small speculators would be individual traders. The fund category would include large, well-capitalized hedge funds, which can have a big influence on the markets. Commercial hedgers include interests with physical products, such as farmers. Tracking the changes in long and short positions held by these powerful players is a worthwhile exercise.
Failures and Limitations of Technical Analysis
Technical analysis is not a perfect science, and it has its limitations. These patterns and indicators are subject to interpretation, and different analysts may come to different conclusions.
No one indicator should be used in isolation when making your trading decisions. One indicator may be a great tool to use, but it’s important to verify the information with other tools. Market fundamentals also should not be ignored, particularly if they conflict with what you see on the charts.
Some indicators are lagging, so you need to be aware that they might not offer predictive value. Lastly, technical analysis can’t predict extreme events, such as the 9/11 terrorist attacks in the US or the May 6, 2010 “flash crash” we saw earlier this year.
This information just barely scratches the surface when it comes to technical analysis techniques. If you’d like more information on this topic or have other questions about the markets, please feel free to contract me.
By Kyle McEwan of Lind-Waldock
Kyle McEwan is a market strategist based in Lind-Waldock’s Toronto office and is serving clients in Canada. If you would like to learn more about futures trading, you can contact him at 877-840-5333 or via e-mail at kmcewan@lind-waldock.com.
NOTICE: The data and comments provided above are for information purposes only and must not be construed as an indication or guarantee of any kind of what the future performance of the concerned markets will be. While the information in this publication cannot be guaranteed, it was obtained from sources believed to be reliable. Futures and forex trading involves a substantial risk of loss and is not suitable for all investors. Past performance is not indicative of future results. Please carefully consider your financial condition prior to making any investments. Not to be construed as solicitation

