While many investors or traders have been focused on gold prices, the silver market has actually outperformed in a big way, but it’s come into a round-number resistance level that’s worth studying more.
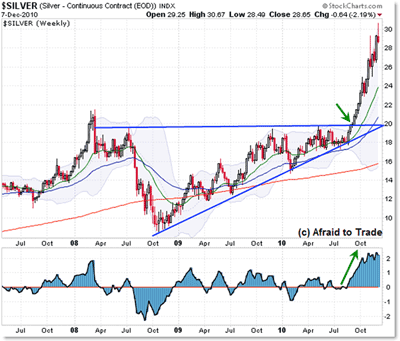
Let’s take a look at the (amazing) weekly chart of silver, then turn to the daily chart for key levels to watch along with a few lessons on entries into breakout markets.
Silver Weekly Chart
If you look very closely, silver prices have had major turns at round numbers such as $10 (the bottom in 2008), key long-term resistance at $20, and once price broke above the $20 resistance. Now we’re facing a similar overhead, round-number resistance at $30.
I think the key to this chart—or the lesson at least—is that commodities can rally for extended periods of time with minimal pullbacks.
Also, a price breakout from a key, obvious resistance level—$20 in this case—clears the way for upside targets that theoretically have no upper limit. Round numbers are always interesting targets to play for, but the question is what will stop the rally?
The long-term chart pattern is that of a two-year ascending triangle that met its rough price projection target at the $30 level recently…so that’s something to watch, too.
Triangle price projections are calculated by taking the height (from the $9 level to the $20 level) of about $11 and adding it to the breakout price at $20, which gives a target in the $30 to $31 region here.
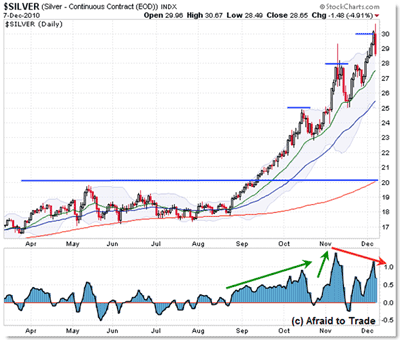
Let’s now turn to the daily chart and then focus on SLV.
Silver Daily Chart
I’ll focus most of the comments on SLV, but I wanted to provide the silver index chart for reference (because it looks a little cleaner than SLV). Chart courtesy of StockCharts.com.
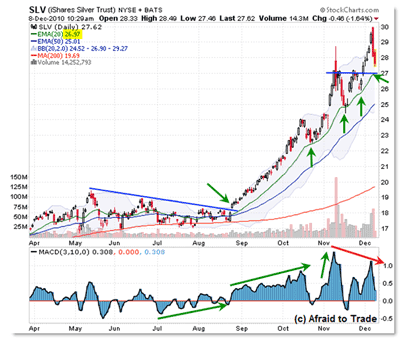
Now let’s move to the tradable/investable iShares Silver Trust ETF (SLV):
The breakout was a little unusual in that, at least in SLV, volume did not come flooding in during the August/September 2010 breakout above resistance. Volume started to pick up on the breakout above $20, but not in an obvious way until November and December.
Anyway, within the context of a breakout market, there are really two main types of trades to take.
|pagebreak|The first is of course the original breakout, which would be late-August/early September, with an official trigger on the break above $20. Breakout trades have theoretically unlimited targets where it’s often best to trail a stop usually under the rising 20 EMA, which would have worked wonders in this situation.
And that brings us to the second type of trade, which is the classic retracement to the rising 20 EMA in the context of a breakout or trending move.
There were three specific opportunities, namely mid-October and then twice in November when SLV’s price pulled back exactly to the rising 20-day EMA, formed a reversal candle, and then rallied back off the support line.
You can place and trail a stop conservatively under the 20 EMA or a bit more aggressively under the 50 EMA (as sometimes price can nip under the 20 EMA and resume its trend, as was the case with mid-November’s doji at the $25 price level).
In the context of a trend, always check momentum and volume—both of which have been rising (new momentum highs often precede new price highs) until recently in December.
So putting it into context, price recently hit a major “round-number” resistance area at $30 per share, which happens to be a rough price pattern projection target. On the push to known resistance, a negative momentum and volume divergence formed.
Divergences are not panic signals, but they are non-confirmations that clue us in to guard open positions a bit more closely and be less biased and more open to new developments in the charts/price.
What Now?
Watch the $27.00 area as a key test of the strength of the rally, as it is both the rising 20-day EMA (again) and a little horizontal trend line as drawn.
As is the usual case, any sharp breakdown under the rising 20 EMA sets a short-term support target of the rising 50-day EMA at $25, which also is the lower Bollinger band.
And of course, any sharp breakdown under $25 argues for a reversal instead of a classic retracement to rising support in the context of an uptrend.
Should be interesting!
By Corey Rosenbloom, trader and blogger, AfraidToTrade.com


