
Market index volatility, commonly measured by looking at the CBOE Volatility Index (VIX), has two main drivers. One is the volatility of the component stocks of the index. In the case of VIX, that’s S&P 500 (SPX) component stocks. The higher the volatility of the components, the higher the implied volatility of the index options.
The other driver is the degree to which the component stocks correlate to one another. The higher the correlation between the component stocks, the higher the index volatility. Why’s that? Well, consider a stock index comprised of four volatile stocks. If two of them were in a fast-moving uptrend, and the other two were speeding to the downside, then you would say there is low correlation. When this is the case, the underlying index will not move all that much, and implied volatility will likely decline despite the fact the components are flying around.
I bring this up because we sit in a bit of a VIX downdraft here, and it’s pretty clear that we have dribbling correlation to blame.
Below is the chart of the VIX over the past three months:
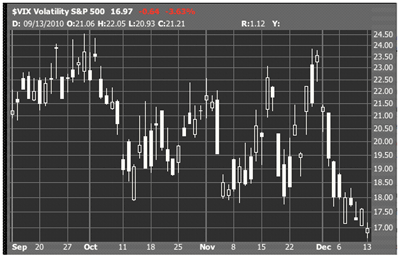
Click
to Enlarge
And here is the correlation index CBOE S&P 500 Implied Correlation Index (KCJ):
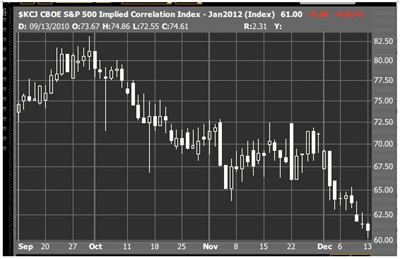
Click
to Enlarge
The real interesting time in this comparison was from early October to around Thanksgiving. The VIX meandered in a range, and at its peak, was actually unchanged. Yet correlation fell off a cliff, and it continues to drop.
Now, KCJ is not the be all and end all of correlation indices. It simply sets an expiration date on the options it indexes—in the case of KCJ it’s January 2012—and sticks with those options until expiration. The problem is that now you’re measuring correlation of 13-month options today, 12-month options if you look a month from now, and seven-month options if you look half a year from now, etc. In other words, you’re somewhat comparing apples to oranges. You’re also only measuring correlation of a select group of big-cap stocks, which sometimes can tell a different story from the correlation of high-flying, small-cap names.
But those caveats aside, options 15 months out don’t differ that materially from options 13 months out, so it’s not a terrible comparison. Nor is it a misstatement to say correlation has tanked lately. Put another way, stock selection has become relatively more important. And general hedging with an SPX-related or a VIX-related product has become relatively cheaper.
Finally, we can use correlation itself as a sentiment proxy. High correlation reflects a high degree of nervousness. When that is the case, stocks tend to move together, sometimes irrationally. Conversely, as we get more comfortable, we differentiate more and diversify our holdings. And right now, this is the most complacency we’ve since May.
By Adam Warner of DailyOptionsReport.com


