Gold, and particularly the popular proxy ETF GLD, has come into a very interesting technical (chart) level right here on both the daily and weekly time frames as we begin 2011.
For investors and traders in gold/GLD, it’s a good idea to be aware of these levels and the “If/Then” chart contingencies these create if the level holds…or breaks.
Let’s start with the weekly GLD structure and then slide down to the daily:
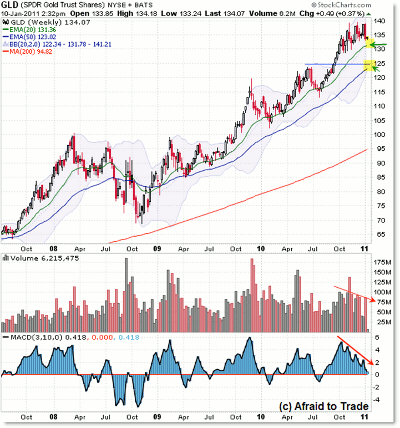
The ETF has doubled in price since the pit of the financial crisis that inflamed around October 2008; then, GLD traded at the $70-per-share level (gold was at $700).
Now, as we begin 2011 with much better economic circumstances, gold has doubled to the $1,400 level, and as you can see, GLD neared the $140 level recently.
Interesting, but what now?
After an extended rally, GLD is showing signs of weakness in the form of obvious negative momentum divergences, as a slight arc pattern has formed in price.
Right now, that’s a big caution signal, but not yet a panic signal by any means. It’s a glaring non-confirmation, but price (and trend) is superior to any indicator.
Turning now to price, the objective level to watch on the weekly chart is the $130 price level, which is currently the rising 20-week EMA ($131.36 right now, to be exact).
In the event that price holds the weekly EMA support, then the divergence is broken or busted, and the rally will likely continue beyond $140.
Article Continues on Page 2
|pagebreak|However, a firm price breakdown under the key $130 level targets an immediate swing back to prior resistance, which will by that time form a confluence with both the rising 50-week EMA (in blue) and the lower Bollinger band—a key level to play for at $125 in the event sellers push gold under $130.
So that’s the main idea from a simple chart perspective—monitor what happens now at the $130 level (Support: Yes or no?) and then if support breaks, then we could see a retest of weekly support at $125.
With that in mind, let’s see the additional details the daily chart reveals:
I always suggest you build a thesis first on the weekly or even monthly charts and then monitor (for confirmation/non-confirmation) the details/data that emerge in real time from the lower frames, such as the daily chart, for a key reference.
That being said, the chart picture doesn’t look good for gold/GLD right now. Of course, that could change suddenly, but right now, the picture is of non-confirmation and caution.
Why Traders Must Use Caution Here
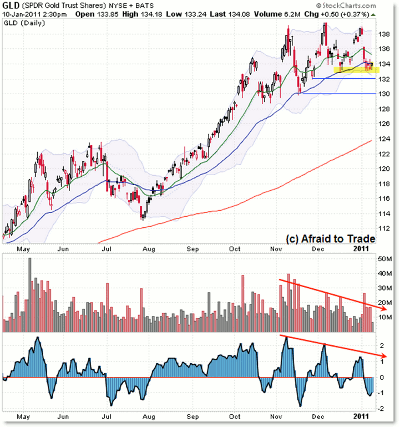
A little “Three-push” pattern complete with visual negative momentum divergence on each recent price push to the $139 level has undercut the recent bullish trend.
Divergences are concepts or components that help us create a narrative, but again, it’s down to price for official signals.
Turning right now to price, the signal is that price is currently under the rising 50-day EMA, a fate that hasn’t happened except for a little nip under (with support just above the 200-day SMA, as expected) in July when stocks bottomed.
The key daily level to watch is around $134, which is setting up to be a (bearish) crossover of the falling 20-day and flattening 50-day EMAs, which would be expected to hold as resistance.
So if buyers push price back above the 50- and then 20-day EMAs, clearing back above $135, then the picture turns back to the bullish camp.
But until then, it’s probably best to take a more cautious posture, particularly if sellers push the price down through the prior daily support swing lows where we are now at $132, and then the big one is at $130.
In other words, it’s perhaps worth taking a:
1) Neutral/cautious (“See what happens”) stance while price is between $130 and $135;
2) Bullish “trend resurgence” stance above $135 (immediate target $140);
3) More bearish stance on a firm break of both daily and weekly support at $130 (target the weekly $125 level).
As a reminder, we never know the future, but rely on objective price levels—and confirmation/non-confirmation from key indicators and volume—for our decision-making and opportunity/risk management.
I’ll be discussing more about trade execution tactics of patterns and structure (what signals actually trigger trades from an aggressive and conservative standpoint, for example) in a presentation on “Trade Execution Tactics” at the New York Trader’s Expo, February 20-23.
I really enjoy the Expos, and traders of all experience levels benefit from attending and networking. I hope you can join us all there!
By Corey Rosenbloom, CMT, trader and blogger, AfraidtoTrade.com


