
An in-depth look at the VIX suggests that prolonged sideways movement could be imminent, and a big volatility spike—like what accompanies big market crashes—may be avoided.
The CBOE Volatility Index (VIX) and related tools (like VXX and VXZ, which track short-and long-term volatility, respectively) measure the implied volatility of S&P 500 Index (SPX) options. As you may know, the Vega (volatility) of an option’s price is the only Greek that is actually human-controlled. All of the others (Delta, Gamma, Theta) are mathematical functions of price, time, etc.
Movements in implied volatility on SPX options (and stocks, ETFs, and any other options) are based on a combination of historical volatility, supply/demand (more buyers push prices/volatility higher), the calendar, and other factors, but ultimately, it is controlled by the market makers, who are obligated to maintain a liquid market in a security’s options.
It is this human aspect of option pricing that makes measures such as the VIX a very good indicator of investor/trader sentiment and fear/panic level.
That’s why Price Headley and myself have been utilizing the VIX in our market timing analysis since the early 1990’s.
In general, in the past, we used the VIX as a contrarian indicator, but in recent years, it has become more of a “smart money” type of reading, in my view, that you don’t want to fade normally. We still look for extremes in VIX movement that often point to key market turning points.
Also keep in mind that volatility and implied volatility tend to rise when the market falls and tend to fall when the market rallies or is stable/quiet. This is because the public buys large amounts of puts (on a relative basis) during times of down moves and fear/panic, so the market makers then “jack up” the premium on options by raising Vega.
The VIX basically utilizes the implied volatility on SPX options to determine market expectations for volatility over the next 30 days (on an annualized basis).
Another way to look at it is how much the market is priced to go up or down in the next year, so with the VIX around 15 currently, this is pricing in that the market may go net up or down 15% over the next 365 days.
See related: Enjoy Low Volatility…If It Lasts
Now to the charts:
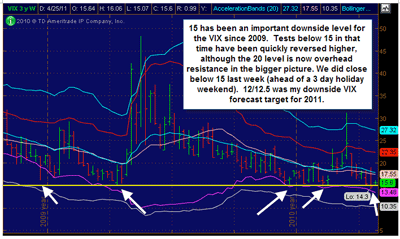
First below is a longer-term VIX weekly chart. You can see here that the 15 level has been an important support level for the VIX multiple times from late-2008 to the present.
Tests of this level have held in this time frame. It doesn’t mean an upward spike is imminent, however, because we’ve often stayed around the 15-20 range for multiple weeks.
Click to Enlarge
We did close a bit below the 15 level last week, but this could be somewhat discounted as an important weekly close because it came ahead of a three-day holiday weekend (and also with a big market rally).
And now this week we’re back above this level despite a relatively strong market. This level will likely hold for the near term.
I previously forecast in late 2010 that the 15 and 12/12.5 levels would be important downside VIX targets for 2011. This has held true thus far, and at this point, a move to my lower targets doesn’t seem imminent, but it is certainly still possible this year.
I still don’t see any likelihood of dropping below that, however, given the wild world events and economic uncertainty we’ve seen.
NEXT: A Closer Look at the VIX Daily Chart
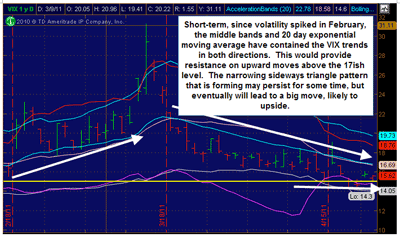
|pagebreak|Zooming in to the recent daily chart below, you can see the VIX moved sharply higher in February and March 2011 with the one-two punch of Libyan unrest (big oil hub) and Japan’s earthquake and tsunami (one of the world’s largest economies).
Note how the VIX held above the middle bands and 20-day exponential moving average (EMA) on its trend higher.
Since mid-March, we’ve seen a real implosion in volatility with the VIX basically getting cut in half. The market’s been mostly strong in this time period, contributing to the deflating of option fear premiums. Also note here how the downtrend has similarly hugged its downsloping middle bands and moving averages (MAs).
Click to Enlarge
Bottom Line
In my analysis, we’re forming a downsloping sideways wedge formation on the VIX with the 15 area providing support. Such a pattern is usually followed by a big move in either direction. In this case, one would anticipate to the upside because of the quick upward spikes possible in the VIX.
However, this narrowing range—let’s say 15 to 17.5 (bigger picture 15 to 20)—can persist for quite some time, so a big breakout (which would be in line with stock weakness and/or unforeseen negative news events) may not be imminent.
Should 15 be taken out with a quiet or bullish spring/summer in the markets, the 12/12.5 area remains my VIX downside target that will likely not be breached for a long time (a year or more).
By Moby Waller of BigTrends.com


