
Analyzing the E-mini (ES) futures using multiple time frames proves that devoting more attention to the larger frames gives more accurate supply and demand levels for making buy and sell decisions.
One of the most perplexing areas of trading is identifying trends early enough to still have low-risk, high-reward entries. Every book ever written on trading has told us that we should always align our buying or selling in the direction of the trend, and that this is the key to trading success.
In some respects, that may be true, however, most of these books fail to make three very critical distinctions:
- When is it too late to join the trend?
- What trends are the most important?
- When are trends likely to reverse?
To answer these questions, let's first think in terms of keeping it simple and what would cause a trend to end. First, trends in the shorter term are continuously changing.
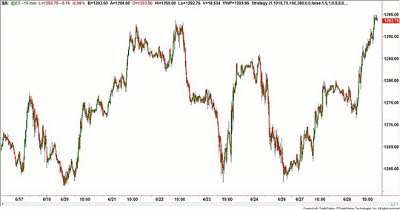
Shown below is a ten-day look back at a 15-minute chart of the ES (E-mini S&P 500). In it, we can see how trends change frequently in the short term, and waiting too long to join these moves can prove dangerous.
Click to Enlarge
Since the direction of price changes so frequently in these smallest of time frames, attention to the bigger picture should come more into focus, as these are the dominant, more powerful shifts in the market.
In addition, by dedicating more attention to the larger trends, you will also enhance your odds of success because this is where the large institutions and hedge funds do the majority of their buying and selling.
NEXT: See These Trends Unfold on Longer-Term Charts
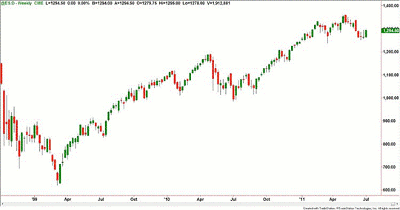
|pagebreak|Therefore, in this weekly chart of the ES shown below, we can see that the trend is still higher, and if we want to “join” the trend, we should focus on buying dips when approaching quality demand zones.
Click to Enlarge
This brings us to the question of where trends usually reverse. The answer quite simply is that smaller trends tend to reverse—or at least correct—when they touch larger-time-frame supply and demand levels.
In the chart below, note that since it bottomed in March 2009 and began its bull market, the ES (uptrend) has pulled back when it touched or traded into those fresh supply levels that were created when the market was trending lower.
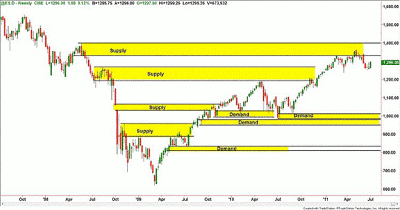
Click to Enlarge
Similarly, the retracements in the bull market were best purchased at (or in) the fresh demand levels formed earlier in the move. Moreover, these demand levels proved to be the lowest-risk entries for joining the uptrend, as opposed to waiting for a new short-term uptrend to get underway.
It's important to understand that when an uptrend in a smaller time frame—in this case a daily frame—approaches a weekly supply zone, going long becomes a high-risk, low-probability trade.
Instead, these areas should be deemed profit-taking zones on long positions, and low-risk countertrend opportunities for initiating short positions.
Put another way: The trend is no longer your friend at these junctures.
The last aspect of trends that is widely misinterpreted is the manner in which these moves culminate. Most downtrends usually end in a massive flurry of panic selling in which everyone owning the market finally has to sell. And when all that selling is done, there is only one direction for the market to move: up.
In the same way, when the market has been moving up steadily and people are chasing returns, everyone who wants to own the market already does. Thus, when demand diminishes and supply increases, the market has only one direction to go: down.
In summary, the larger trends can indeed be used as a way to increase our odds in trading. Additionally, supply and demand levels should be an integral part of any trend analysis, as identifying these zones is the only way to quantify real buyers and sellers.
By Gabe Velazquez


