High-risk market conditions and fundamental factors point to higher metals prices in the long term, but trader JW Jones explains why the charts for gold and silver both indicate an impending selloff.
Currently, risk assets are in a constant crossfire stemming from multiple forms of headline risk. The price action as of late has been choppy, as the news flow is directly impacting the tape.
I have been reluctant to accept any significant risk recently, and I would point out that cash has certainly outperformed the S&P 500 over the past six or seven trading sessions.
The news flow and economic event risk is reminiscent of 2008, when traders were sitting on edge waiting for the next piece of information detailing which investment bank would fail next. Economic reports were dismal, earnings disappointed, and structural unemployment reports spewed from the media.
The fear was palpable back then, and the current backdrop within the financial market construct feels eerily the same way.
This is not to say that I expect lower prices in the S&P 500, it is simply an acknowledgment of what transpired in the past. I remember initially trading small through various parts of the crisis, but after getting chopped around, I determined that sitting on the sidelines was a much less stressful strategy.
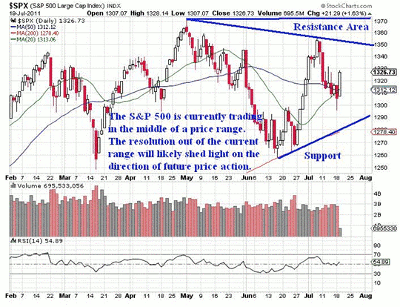
At this time, I do not have a directional bias regarding the S&P 500, but what is evident to me is that this market is coiled up and the resolution of price discovery will be harsh regardless of which direction price ultimately moves.
I expect the eventual resolution of price will be followed by strong volume and momentum and Mr. Market will tip his hand, if only for a moment. The outcome will be an extremely strong move in the underlying price action of the S&P 500.
As always, the most important question is which way will Mr. Market ultimately favor?
The daily chart of the S&P 500 Index (SPX) illustrates the key price levels that will serve as clues about the short-term price action in the index:
Instead of focusing on my agnostic position as it relates to the short-term price action in the S&P 500 index, I determined that I would ruffle a few feathers and reiterate why I am expecting a looming correction in gold and silver.
Article Continues on Page 2
|pagebreak|But before the hate mail begins piling up, I would point out that in the longer term, I remain a precious metals bull. However, astute traders recognize the inability of an underlying to rise in perpetuity.
Gold futures have risen from $1,478.30 per ounce on July 1 to $1,607.90 per ounce at the close of business on July 18. The move higher in gold represents a net-positive 8.76% gain in the price of gold in the past 17 days. In addition, gold futures have tested recent highs and broken out to the upside.
Silver has also been on a tear higher. Silver futures have rallied from $33.47 per ounce on July 1 to as high as $40.88 per ounce on July 19. The change in price represents a net 22.14% gain in less than three weeks.
As I stated above, in the longer term, I continue to believe that higher prices are likely for both precious metals as a result of the continued devaluation of the US dollar by the Federal Reserve.
The Federal Reserve is not alone to blame, however, as multiple Presidents, Congress, and agency heads have been complicit in creating the economic problems facing the United States as a country. The charlatans like to point the finger at one another, but in the end, they are all to blame.
In addition to the wasteful spending practices and failed stimulus packages coming out of Washington, we recently heard from Federal Reserve chairman Ben Bernanke during his recent press conference. In an unbelievable, two-day media blitz, the Fed chief went back and forth regarding the steps the Federal Reserve would take if the US economy began to stall.
Ultimately, Mr. Bernanke has threatened to initiate new quantitative easing (QE3), and if such a program takes place, the price of gold and silver will only go higher in the longer term. However, at this time, I am viewing the price action in both metals as overbought, or certainly nearing an overbought condition.
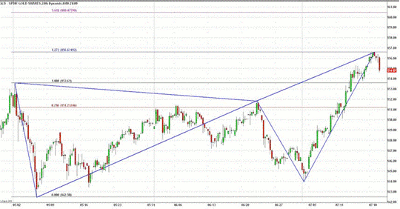
Another catalyst for a possible pullback or even a potential selloff in gold can be found on the four-hour chart of the SPDR Gold Trust (GLD). The existence of a bearish Fibonacci butterfly on the chart shown below lends credence to further downside.
I would make sure to point out that if the pattern fails, the move higher will be swift and harsh. The pattern would still be intact if prices were to get to $160 per share on GLD.
Fibonacci butterfly patterns show up all the time in price action. Just like any other type of analysis, they are not foolproof, nor do they always work out. However, the presence of such a pattern must be noted.
If the pattern fails, gold will be off to the races, but if the pattern plays out, a selloff is right around the corner.
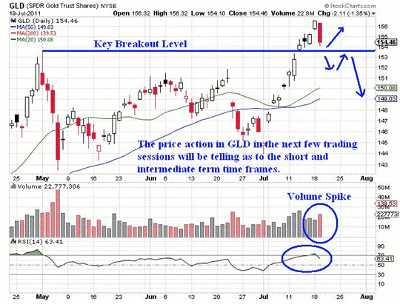
I am anticipating that a possible back test of the recent breakout level seen on the GLD daily chart below is becoming increasingly more likely.
If price tests the breakout level and support holds, we could see a move to the $160 per share price level play out. However, if the price of GLD falls below the key breakout level, the daily chart will have carved out a failed breakout and lower prices will be imminent. For short-term gold traders, caution should be warranted.
NEXT: It's a Similar Story for Silver
|pagebreak|It's a Similar Story for Silver
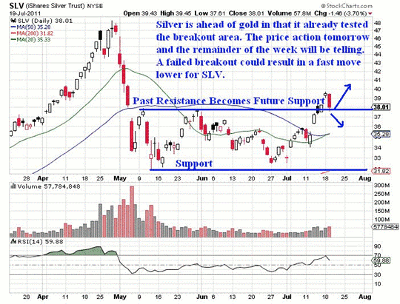
Switching gears to silver, a back test of the breakout level is likely. Similar to gold, how price handles the breakout level will be telling. If silver prices push through support, it is likely that the white metal will sell off sharply and price would carve out a failed breakout, which could add momentum and volume to the selloff.
Currently (at time of writing), silver is testing the breakout level. The next few trading sessions will be critical in determining the price action of the white metal in the short run. The daily chart of the iShares Silver Trust (SLV) is shown below:
The price action the remainder of this week and next week will be very telling about future prices for precious metals. We could see back tests that hold on gold and silver and higher prices in the near term, or we could see breakdowns that carve out failed breakouts and fast moves lower.
Longer term, I still like precious metals, but both gold and silver are due for short-term pullbacks. The question precious metals investors and traders should be considering is whether we experience a short-term pullback or whether prices sell off sharply?
With regard to risk assets in general, at present, I would reiterate that headline and market risk are exceedingly high, so proceed with caution!
By JW Jones of OptionsTradingSignals.com


