Shares of KBR Inc. (KBR) look solid on all time frames, and given clearly defined support levels and price targets, traders now have a set-up offering a 5:1 reward-to-risk ratio.
KBR Inc. (KBR) has been on my radar for a few months, and it may now be time to jump in with both feet. After posting better-than-expected earnings numbers on Wednesday night (July 27) and giving higher guidance, there is now no more news to stand in the way.
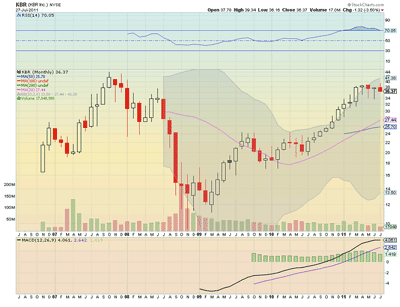
Let me explain why the stock looks attractive on all time frames. First, let’s take a look at the monthly chart:
The monthly chart above shows that KBR is in a bull flag formation and is working off an overbought condition. During this time, it has moved back within the Bollinger bands, and the Relative Strength Index (RSI) is working lower.
The Moving Average Convergence Divergence (MACD) indicator is still very positive as well. There is resistance from the all-time high at $44.01 on a breakout above the flag and a measured move target of $54. Support comes in at $34 on this time frame and then $28 below there.
NEXT: Shorter Time Frames Give Added Confirmation
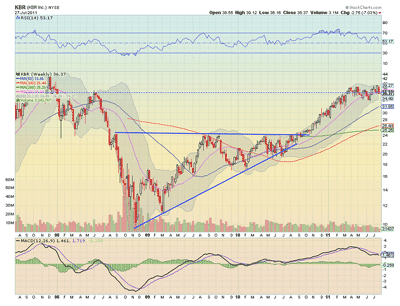
|pagebreak|Moving to weekly chart below shows the importance of the area between $36.70 and $37.30.
This area is also just below the target of $38 on the break above the ascending triangle breakout from September. It is no wonder that this area is causing a pause in the form of a bull flag. A break above the flag would trigger a target of $52.
On this time frame, the RSI is holding over the 50 mid-line and the MACD is approaching a positive cross as it rides the 20-week simple moving average (SMA) higher. Support comes in at $34 and then at $32 below there.
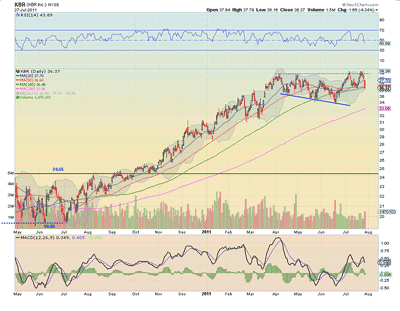
Finally, looking to the daily time frame below shows that KBR has bounced off on the top of an expanding wedge for the fourth time and is in a support area among the simple moving averages.
Currently, $36 is holding as support with $34 below there on this time frame. Resistance is at $38 with a target on a break of the wedge at $43.
In summary, the monthly chart suggests a break above the flag with resistance at $44.01 and a target of $54.
The weekly chart adds resistance at $52 as well, while the daily suggests a little work is needed to get above $38 to test first resistance at $43. All time frames see support at $34 and the daily adds support at $36 as well.
A long-term trade where you risk $3 to make $15 or more—a reward-to-risk ratio of more than 5:1—is not too shabby! Of course, you can also wait for the break of $38 to increase your odds.
By Greg Harmon of Dragonfly Capital


