This multi-part article series begins with a review and definition of the three types of chart patterns and trends that are central to Gann Theory.
Gann Theory is a popular style of analysis that looks at patterns and repeatable price action based on time. After receiving some e-mails on the subject, I decided it best to examine Gann Theory a bit further in my articles. I am not going to go into the history of it or give a biography of W.D. Gann, but I will instead discuss some practical applications of some of Gann's theory.
There are three trends applicable to any time frame that you are analyzing: Minor, intermediate, and major. That also means that there are three types of swing highs and lows that correspond with these trends. In this article, the Gann swing highs and lows I labeled as "Gann Swings" are actually intermediate swings.
Let's now examine the definitions of swing bottoms (lows) and swing tops (highs).
Gann Minor Swings
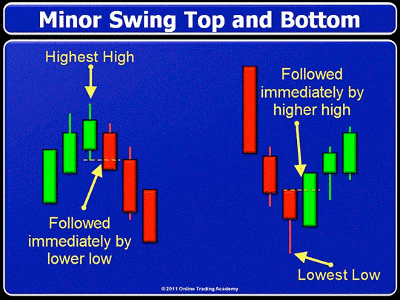
A minor bottom is a low price compared to previous lows which is followed immediately on the next bar or candle by a higher low and a higher high.
The minor top is a higher high compared to previous highs in price which is followed immediately by a lower high and a lower low.
Gann Intermediate Swings
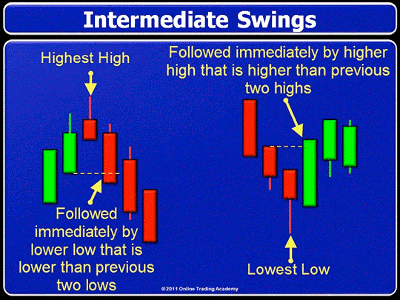
The intermediate bottom is also a lower low compared to previous lows. However, it differs in that the immediate high that follows must be higher than the previous two bars or candles.
The intermediate top is a higher high than previous highs that is immediately followed by a low that is lower than the previous two lows.
NEXT: Identifying Major Swing Tops and Bottoms
|pagebreak|Gann Major Swings
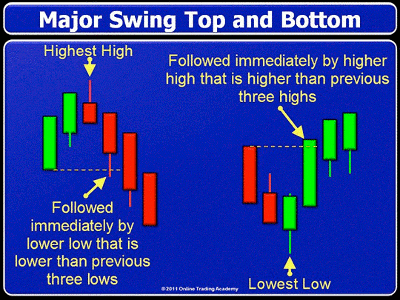
A major bottom will hold much significance to a trader using Gann Theory for their analysis. A major bottom would be a low price on a bar or candle that is lower than previous lows but is immediately followed by—you guessed it—a high that is higher than the previous three bars or candle highs.
The major top is a high that is higher than previous price action followed immediately by a low that is lower than the previous three bars or candles.
Identifying the Trend
If you see price breaking a previous swing top, then you are in an uptrend in the time frame and level (minor, intermediate, or major) that you are trading in. You would continue to trade only in the long direction until you break a previous swing bottom of the same degree.
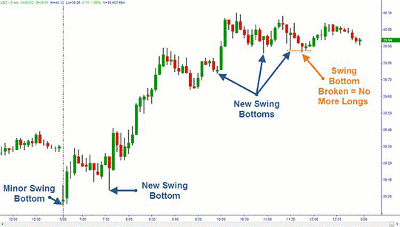
For instance, the following chart of the United States Oil Fund (USO) opens the day with a minor swing bottom. If we were already in an intermediate uptrend, a trader could use that as an opportunity to trade long intraday until a swing bottom is broken. In fact, they may want to enter or add to longs when a new swing bottom is formed.
After the minor swing bottom is broken, a trader should wait for a new intermediate or major swing bottom to form before entering any additional long positions.
In Gann trend analysis, a downtrend occurs when price breaks a swing bottom. If price moves downward in a defined uptrend but does not break a swing bottom, it is deemed a correction and the trader has no need to exit their long. A break of a swing bottom would constitute an exit signal.
The rules would be the same for a downtrend: Once a major downtrend has been established for the time frame you are trading in, you could look to short intermediate or minor swing tops until they are broken.
More in Part 2.
By Brandon Wendell, instructor, Online Trading Academy


