This multi-part article series concludes with practical application of Gann Theory and use of a "Gann Fan," a chart tool that helps identify key support and resistance levels and favorable trade set-ups.
Now that we have discussed the major, intermediate, and minor tops and bottoms in Part 1 and Part 2, we can now introduce a tool called the "Gann Fan" to identify potential support and resistance levels as we move in trend from those areas.
This is not necessarily going to replace the supply and demand levels that you are already familiar with on your charts, but they can add to your precision when choosing entry and exit points for trades.
Gann believed that price moved in certain repeatable patterns based on price and time. In using the angles of the fan, you are looking at areas where prices are likely to turn due to a combination of the two. Since there are cycles that can be seen in all securities, a trend that is approaching the end of that cycle should turn at a predictable point. That point is the intersection of a fan.
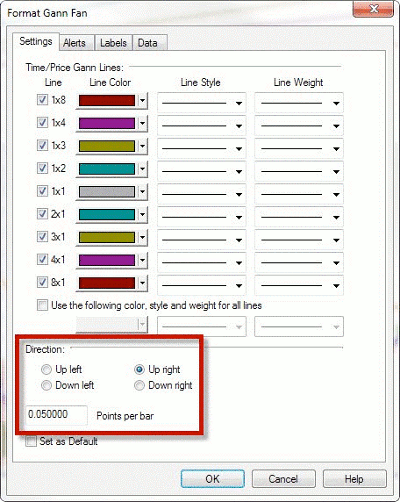
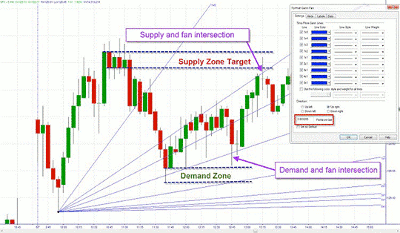
TradeStation does have Gann Fans available on the program, but there is a catch: You will have to enter the "Points per bar" that will set the angle and also the direction of the fan (see below).
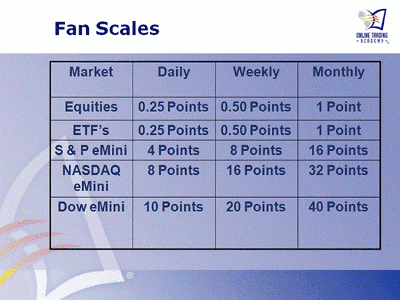
There is a guide as to the points per bar we should use for most securities. I have included a table here:
NEXT: See Gann Fans at Work on the Charts
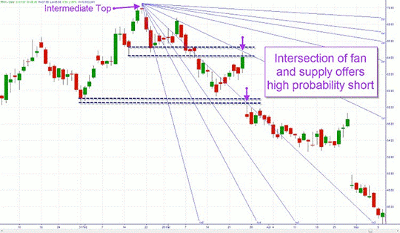
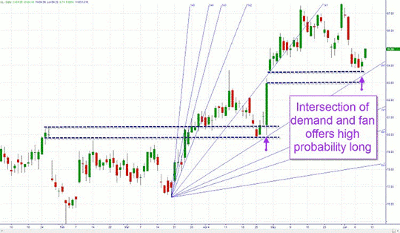
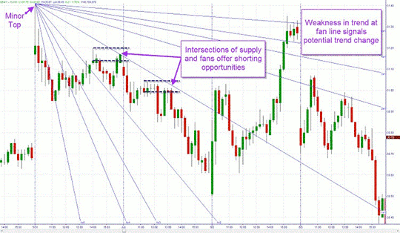
|pagebreak|Let's see an example of how this works on a chart. We want to place these fans at the tops or bottoms that we are using as our starting point for the trend we are trading. That way we can identify the supply and demand levels that are likely to reverse our security's price.
You may have noticed that both examples were on daily charts. Even the tables I showed only go as small as daily charts. So, what can we do if we are going to trade intraday? Well, we need to adjust the Points per bar for intraday trading. You would simply do this by dividing the number of candles in a day into the daily table number.
For example, there are 78 five-minute candles per day. Dividing 78 into 0.25 tells us that we need to put 0.003205 into the Points per bar for trading on a five-minute candle chart.
If we are using a 15- minute chart, then we would divide 26 (there are 26 15-minute candles in a day) into 0.25 and use 0.009615.
So, experiment with the fans and see if they can help you as an odds enhancer for your trading. Until next time, trade safe and trade well!
By Brandon Wendell, instructor, Online Trading Academy

