Following volume trends is one of the best ways to get a big-picture, real-market look at your intended trades.
Let’s go back to basics. Technical analysis is the study of market action, i.e. the interactions of buyers and sellers. Rather than the merits of what is being bought and sold, we analyze these interactions in search of patterns and trends that will identify profitable opportunities.
But the information available to the technical analyst does not need to consist merely of price movements; technical data is anything related to market action. The level of participation in the market, therefore, is also an important component of this data. We measure it by the number of stocks or futures contracts that are traded over any given period and call it volume. The reason for the name is fairly simple: in a trading pit, it would be directly proportional to the noise!
Volume is available for nearly any market, except for forex, whose decentralized structure makes a measurement impossible!
So what’s useful about volume?
Volume tells us where the majority of people are taking and covering their positions, so it has big implications in terms of market memory.
For example, suppose that during a rally in a stock, we notice that there is a price range where volume is particularly high. What does this mean? It means that there are many positions originating and closing here. Going forward, then, there are a lot of participants who have a “stake” in this particular price region.
If the price gets back here, people who bought in the first time might use this as an opportunity to pick up more of the stock at what they still consider to be good value. This is manifested in the price finding support here instead of falling back down.
On the other hand, what happens if sellers do come out in enough force to take us through this region? In that case, anybody who went long there is now offside and may be tempted to exit their positions. Lots of stops can get triggered, resulting in an acceleration of the decline.
So that’s the significance of volume: it tells us where most people are taking their positions. You could almost say that the market “remembers” levels in direct proportion with the level of volume seen when it trades around those levels.
NEXT: Using Volume to Get Valuable Confirmation
|pagebreak|Volume has long been a key component of technical analysis. One of the tenets of Dow Theory is that “Volume must confirm the trend.” High volume demonstrates mass participation in a move, and hence, widespread acceptance of the new price levels.
Price moves without volume were subject to suspicion, since it was possible that only a small number of rogue traders were moving the price. In that case, the price would revert back to where it came from as soon as they stopped participating.
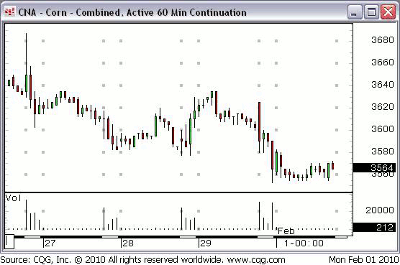
It should be noted that sometimes volume will be so light that the relevance of the price levels becomes negligible. This is true, for example, in the overnight session for the agricultural commodities. Here’s a sample:
While the overnight price action will be visible to traders, some of whom may give it some small consideration, the volumes are so small that the levels can generally be ignored.
One common way in which volume is used is in the confirmation of price patterns. This is in the same spirit as Dow Theory: just as volume should confirm a trend, it should equally confirm a reversal or continuation pattern.
For example, consider the famous head and shoulders pattern. This begins with a series of higher highs and higher lows, a classic Dow Theory uptrend. But then we get a high below the prior high, and then a fall through the “neckline” connecting the previous two lows.
There are definite patterns in volume which we may seek to accompany the head and shoulders. These may not always appear, but that’s ok: volume is only an additional piece of the jigsaw, and not the most important piece of evidence we look at when analyzing the markets.
Volume is always secondary to price. That said, we are encouraged when we see volume acting in a way that confirms the price action: for a head and shoulders pattern, that means cooling off as the market runs into resistance, and then expanding as the market decisively changes direction.
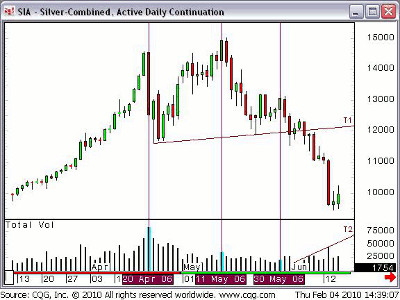
The above head and shoulders pattern for silver shows volume declining on each successive peak, and then expanding as it completes the pattern with a severe breakdown.
Volume can also be incorporated into momentum indicators, usually in combination with some price information.
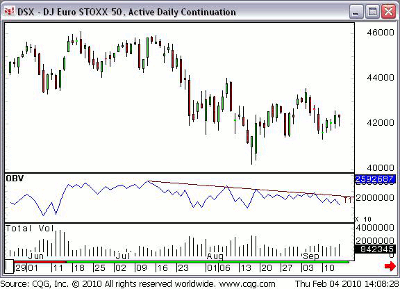
For example, on-balance volume (OBV, see below) is a type of running sum of the volume. The trick is that we add the volume when the market has gone up, but subtract it when it goes down.
We can treat the OBV like any other indicator: adding moving averages, trendlines, etc. The trendline added to OBV above illustrated how the market was struggling.
So that’s an overview of volume: as a core component of technical analysis, it confirms trends and price patterns, and can be incorporated into momentum indicators. An essential tool of the technician and trader!
By Graham Neary, MSTA (graham@futurestechs.co.uk)


